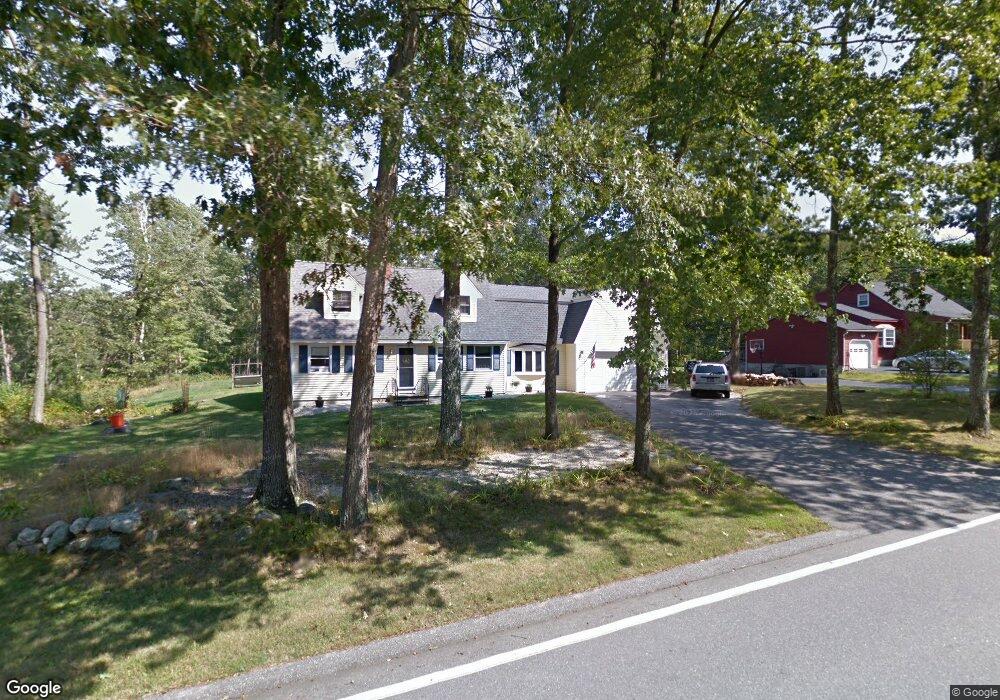
66 Hovey Rd Londonderry, NH 03053
Estimated Value: $569,000 - $658,000
4
Beds
2
Baths
2,139
Sq Ft
$289/Sq Ft
Est. Value
About This Home
This home is located at 66 Hovey Rd, Londonderry, NH 03053 and is currently estimated at $618,090, approximately $288 per square foot. 66 Hovey Rd is a home with nearby schools including Matthew Thornton Elementary School, Londonderry Middle School, and Londonderry Senior High School.
Ownership History
Date
Name
Owned For
Owner Type
Purchase Details
Closed on
Jul 5, 2017
Sold by
Phelps Jason T and Phels Margot D
Bought by
Phelps Ft
Current Estimated Value
Purchase Details
Closed on
Jan 19, 2001
Sold by
Dyson Michelle D and Dyson Lori
Bought by
Phelps Jason T and Phelps Margot D
Home Financials for this Owner
Home Financials are based on the most recent Mortgage that was taken out on this home.
Original Mortgage
$202,500
Interest Rate
7.52%
Purchase Details
Closed on
Aug 24, 1998
Sold by
Dyson Joseph M and Dyson Janice D
Bought by
Dyson Michelle D and Dyson Lori
Home Financials for this Owner
Home Financials are based on the most recent Mortgage that was taken out on this home.
Original Mortgage
$156,289
Interest Rate
6.86%
Create a Home Valuation Report for This Property
The Home Valuation Report is an in-depth analysis detailing your home's value as well as a comparison with similar homes in the area
Home Values in the Area
Average Home Value in this Area
Purchase History
| Date | Buyer | Sale Price | Title Company |
|---|---|---|---|
| Phelps Ft | -- | -- | |
| Phelps Jason T | $225,000 | -- | |
| Dyson Michelle D | $158,500 | -- |
Source: Public Records
Mortgage History
| Date | Status | Borrower | Loan Amount |
|---|---|---|---|
| Previous Owner | Dyson Michelle D | $20,000 | |
| Previous Owner | Dyson Michelle D | $202,500 | |
| Previous Owner | Dyson Michelle D | $156,289 |
Source: Public Records
Tax History Compared to Growth
Tax History
| Year | Tax Paid | Tax Assessment Tax Assessment Total Assessment is a certain percentage of the fair market value that is determined by local assessors to be the total taxable value of land and additions on the property. | Land | Improvement |
|---|---|---|---|---|
| 2024 | $7,478 | $463,300 | $201,500 | $261,800 |
| 2023 | $7,251 | $463,300 | $201,500 | $261,800 |
| 2022 | $7,215 | $390,400 | $151,100 | $239,300 |
| 2021 | $7,176 | $390,400 | $151,100 | $239,300 |
| 2020 | $6,783 | $337,300 | $113,200 | $224,100 |
| 2019 | $6,540 | $337,300 | $113,200 | $224,100 |
| 2018 | $6,080 | $278,900 | $94,500 | $184,400 |
| 2017 | $6,027 | $278,900 | $94,500 | $184,400 |
| 2016 | $5,996 | $278,900 | $94,500 | $184,400 |
| 2015 | $5,862 | $278,900 | $94,500 | $184,400 |
| 2014 | $5,882 | $278,900 | $94,500 | $184,400 |
| 2011 | -- | $279,100 | $94,500 | $184,600 |
Source: Public Records
Map
Nearby Homes
- 20 Wedgewood Dr
- 10 Judy Dr
- 57 Hardy Rd
- 75 Rockingham Rd
- 6 Sugar Plum Ln
- 107a Gilcreast Rd Unit A
- 50 Bartley Hill Rd
- 24 Jefferson St
- 38 Bartley Hill Rd
- 267 Winding Pond Rd
- 118 Fieldstone Dr Unit 118
- 169 Fieldstone Dr
- 103 Rockingham Rd Unit 1
- 103 Rockingham Rd Unit 2
- 193 Fieldstone Dr
- 193 Fieldstone Dr Unit 193
- 36 Perkins Rd
- 3 Exeter St
- 18 Maple St Unit 1
- 8 Laurel St