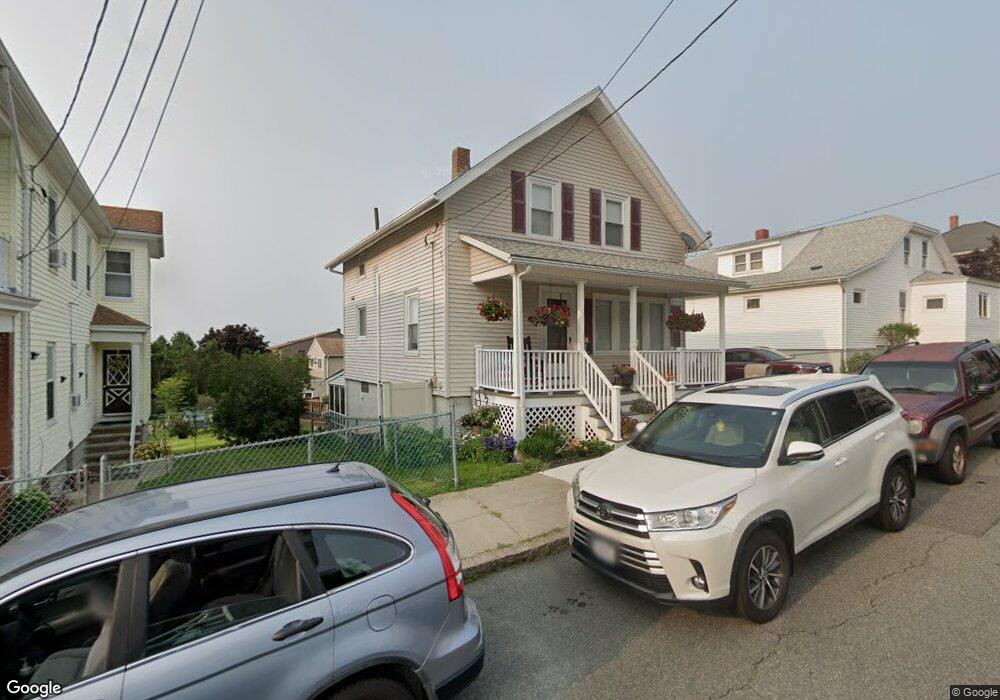
66 Howland St Fall River, MA 02724
Sandy Beach NeighborhoodEstimated Value: $339,000 - $505,000
2
Beds
2
Baths
1,085
Sq Ft
$364/Sq Ft
Est. Value
About This Home
This home is located at 66 Howland St, Fall River, MA 02724 and is currently estimated at $395,104, approximately $364 per square foot. 66 Howland St is a home located in Bristol County with nearby schools including Carlton M. Viveiros Elementary School, Matthew J. Kuss Middle School, and B M C Durfee High School.
Ownership History
Date
Name
Owned For
Owner Type
Purchase Details
Closed on
May 31, 1991
Sold by
Guay Lauretta
Bought by
Santos Joseph F and Marlene Santos
Current Estimated Value
Home Financials for this Owner
Home Financials are based on the most recent Mortgage that was taken out on this home.
Original Mortgage
$80,000
Interest Rate
9.35%
Mortgage Type
Purchase Money Mortgage
Create a Home Valuation Report for This Property
The Home Valuation Report is an in-depth analysis detailing your home's value as well as a comparison with similar homes in the area
Home Values in the Area
Average Home Value in this Area
Purchase History
| Date | Buyer | Sale Price | Title Company |
|---|---|---|---|
| Santos Joseph F | $101,200 | -- |
Source: Public Records
Mortgage History
| Date | Status | Borrower | Loan Amount |
|---|---|---|---|
| Open | Santos Joseph F | $50,063 | |
| Closed | Santos Joseph F | $20,000 | |
| Closed | Santos Joseph F | $80,000 | |
| Closed | Santos Joseph F | $80,000 |
Source: Public Records
Tax History
| Year | Tax Paid | Tax Assessment Tax Assessment Total Assessment is a certain percentage of the fair market value that is determined by local assessors to be the total taxable value of land and additions on the property. | Land | Improvement |
|---|---|---|---|---|
| 2025 | $3,493 | $305,100 | $115,300 | $189,800 |
| 2024 | $3,317 | $288,700 | $113,000 | $175,700 |
| 2023 | $3,147 | $256,500 | $101,800 | $154,700 |
| 2022 | $2,954 | $234,100 | $96,100 | $138,000 |
| 2021 | $2,747 | $198,600 | $91,800 | $106,800 |
| 2020 | $2,743 | $189,800 | $87,600 | $102,200 |
| 2019 | $2,744 | $188,200 | $91,500 | $96,700 |
| 2018 | $2,585 | $176,800 | $92,200 | $84,600 |
| 2017 | $2,465 | $176,100 | $92,200 | $83,900 |
| 2016 | $2,385 | $175,000 | $95,000 | $80,000 |
| 2015 | $2,294 | $175,400 | $95,000 | $80,400 |
| 2014 | $2,207 | $175,400 | $95,000 | $80,400 |
Source: Public Records
Map
Nearby Homes
- 80 Howland St
- 56 Howland St Unit 2
- 56 Howland St
- 153 Andrews St
- 96 Howland St
- 69 Howland St
- 79 Howland St
- 57 Howland St
- 106 Howland St
- 131 Andrews St
- 89 Howland St
- 45 Howland St
- 130 Andrews St
- 119 Andrews St
- 228 Bayview St
- 200 Bayview St
- 200 Bayview St Unit 2
- 25 Howland St
- 184 Bayview St
- 124 Howland St
Your Personal Tour Guide
Ask me questions while you tour the home.