T
Seller's Agent in 2018
Thomas OHearn
Cranberry Real Estate
(508) 737-1776
12 in this area
22 Total Sales

Estimated Value: $1,220,000 - $1,796,000
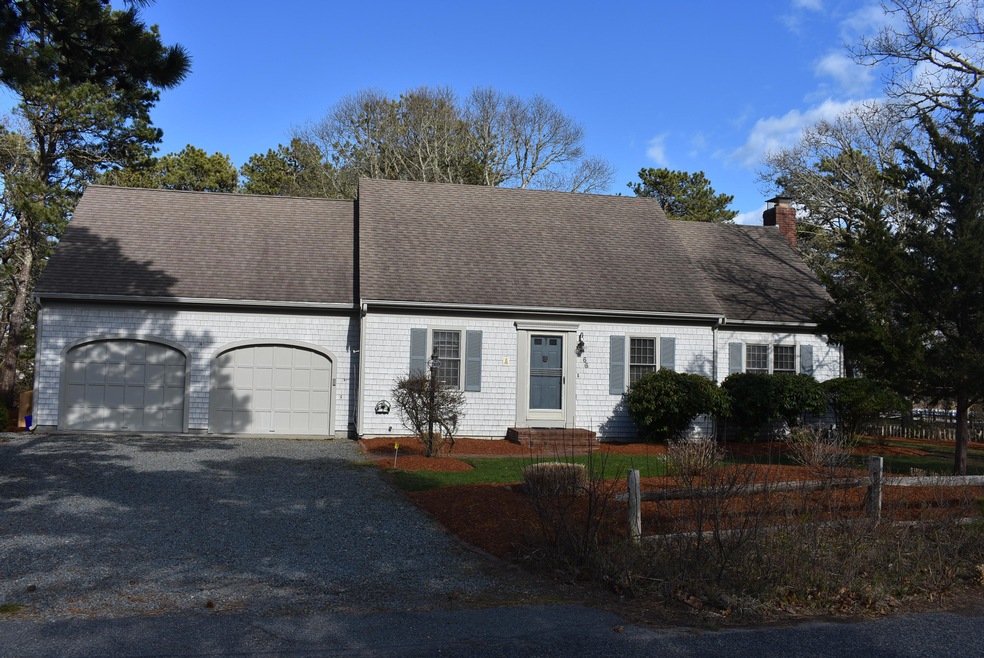
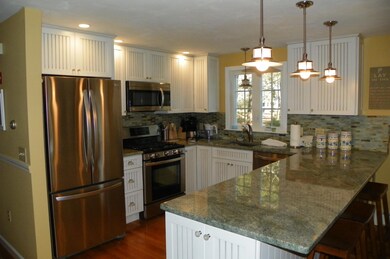
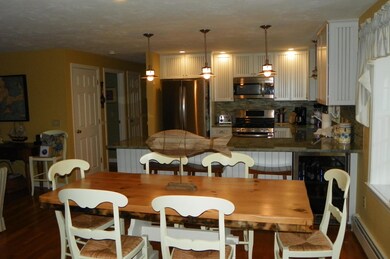
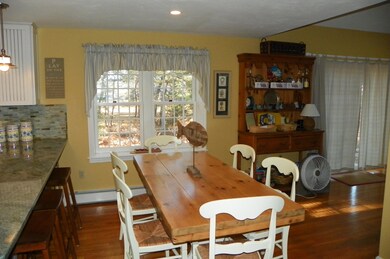
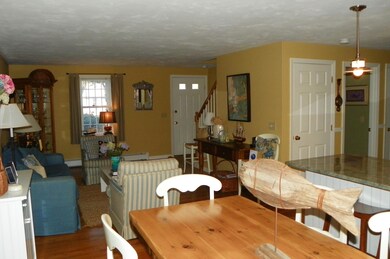
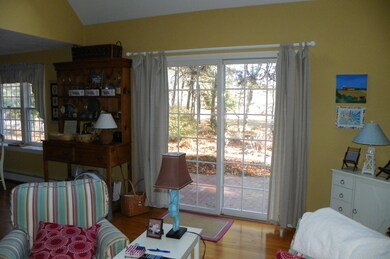
West Dennis Cape custom built in 1992 Cape featuring 3 bedrooms (one on first floor) two full baths, first floor laundry, modern granite counter and island kitchen, stainless steel appliances, dining area, family room, living room with fireplace, hardwood flooring throughout the 1st floor. 2nd floor has two bedrooms one being large master with double closets. Next to master is an adjoining home office or media room. Full bath on the second floor. Attached two car garage with inside entry. Full basement. Attached private screened porch, outside patio and an enclosed shower. This fine custom built home is in pristine condition. Offering a very short walk to the beautiful West Dennis Beach where you will enjoy the warm waters of Nantucket Sound. This home is not in the flood zone.
Last Agent to Sell the Property
Cranberry Real Estate License #80821-B Listed on: 04/12/2018
| Date | Buyer | Sale Price | Title Company |
|---|---|---|---|
| Greene John S | -- | None Available | |
| Greene John S | -- | None Available | |
| Greene Kim | -- | None Available | |
| Greene Kim | -- | None Available | |
| Greene Dorothy A | $799,900 | -- | |
| Greene Dorothy A | $799,900 | -- | |
| Mk Rt | $560,000 | -- | |
| Mk Rt | $560,000 | -- | |
| Saint Jacqu Joyce M | $100,000 | -- | |
| Saint Jacqu Joyce M | $100,000 | -- |
| Date | Status | Borrower | Loan Amount |
|---|---|---|---|
| Previous Owner | Saint Jacqu Joyce M | $448,000 | |
| Previous Owner | Saint Jacqu Joyce M | $151,000 | |
| Previous Owner | Saint Jacqu Joyce M | $150,000 |
| Date | Event | Price | List to Sale | Price per Sq Ft |
|---|---|---|---|---|
| 06/20/2018 06/20/18 | Sold | $799,900 | 0.0% | $374 / Sq Ft |
| 05/29/2018 05/29/18 | Pending | -- | -- | -- |
| 04/13/2018 04/13/18 | For Sale | $799,900 | -- | $374 / Sq Ft |
| Year | Tax Paid | Tax Assessment Tax Assessment Total Assessment is a certain percentage of the fair market value that is determined by local assessors to be the total taxable value of land and additions on the property. | Land | Improvement |
|---|---|---|---|---|
| 2025 | $4,151 | $958,700 | $324,700 | $634,000 |
| 2024 | $4,100 | $934,000 | $312,300 | $621,700 |
| 2023 | $3,929 | $841,300 | $276,000 | $565,300 |
| 2022 | $3,913 | $698,800 | $269,900 | $428,900 |
| 2021 | $3,831 | $635,300 | $264,600 | $370,700 |
| 2020 | $3,940 | $645,900 | $292,500 | $353,400 |
| 2019 | $3,128 | $506,900 | $204,800 | $302,100 |
| 2018 | $3,584 | $565,300 | $273,000 | $292,300 |
| 2017 | $3,077 | $500,300 | $208,000 | $292,300 |
| 2016 | $3,200 | $490,000 | $240,500 | $249,500 |
| 2015 | $3,136 | $490,000 | $240,500 | $249,500 |
| 2014 | $2,814 | $443,100 | $201,500 | $241,600 |
T
Seller's Agent in 2018
Thomas OHearn
Cranberry Real Estate
(508) 737-1776
12 in this area
22 Total Sales
Source: Cape Cod & Islands Association of REALTORS®
MLS Number: 21802323
APN: DENN-000028-000000-000056
Disclaimer: Certain information contained herein is derived from information provided by parties other than Homes.com. All information provided is deemed reliable, but is not guaranteed to be accurate and should be independently verified.
![]() All data relating to real estate for sale on this page comes from the Broker Reciprocity (BR) of the Cape Cod & Islands Multiple Listing Service, Inc. Detailed information about real estate listings held by brokerage firms other than CC&I Assoc. of REALTORS®, Inc. includes the name of the listing company. Neither the listing company nor CC&I Assoc. of REALTORS®, Inc. shall be responsible for any typographical errors, misinformation, misprints and shall be held totally harmless. The Broker providing this data believes it to be correct, but advises interested parties to confirm any item before relying on it in a purchase decision. All properties are subject to prior sale, changes, or withdrawal. Copyright 2026 © Cape Cod & Islands Multiple Listing Service, Inc. All rights reserved.
All data relating to real estate for sale on this page comes from the Broker Reciprocity (BR) of the Cape Cod & Islands Multiple Listing Service, Inc. Detailed information about real estate listings held by brokerage firms other than CC&I Assoc. of REALTORS®, Inc. includes the name of the listing company. Neither the listing company nor CC&I Assoc. of REALTORS®, Inc. shall be responsible for any typographical errors, misinformation, misprints and shall be held totally harmless. The Broker providing this data believes it to be correct, but advises interested parties to confirm any item before relying on it in a purchase decision. All properties are subject to prior sale, changes, or withdrawal. Copyright 2026 © Cape Cod & Islands Multiple Listing Service, Inc. All rights reserved.
