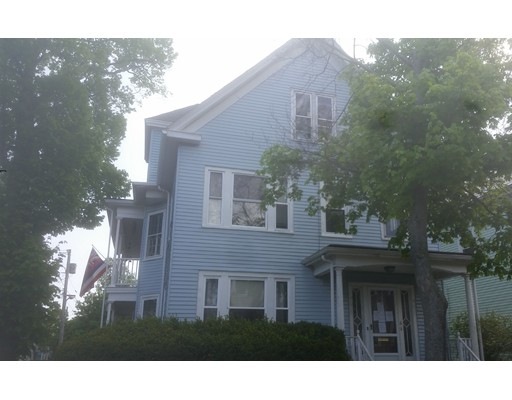
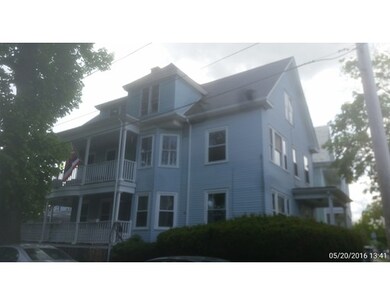
66 Leach St Unit C Salem, MA 01970
South Salem NeighborhoodAbout This Home
As of June 2019Priced below market value -- Tons of natural light! Large living/dining room w/ hardwood floors & built-in hutch, recessed lighting. Good size bedrooms . Amazing location, only blocks to the ocean & beaches; easy access to public transportation, Forest Park, Derby Wharf, Pickering Wharf & more! Buyers to assume all costs and responsibilities to have utilities turned on. All cash offers must have 10% EMD within 48 hours of accepted offer with no changes to the sellers addendum's. Property is being sold “as is†. Property will not qualify for FHA or VA loans. Buyers are responsible for smoke certificate and title five if applicable. Buyers agent to confirm all MLS data.

Ownership History
Purchase Details
Home Financials for this Owner
Home Financials are based on the most recent Mortgage that was taken out on this home.Purchase Details
Home Financials for this Owner
Home Financials are based on the most recent Mortgage that was taken out on this home.Purchase Details
Purchase Details
Home Financials for this Owner
Home Financials are based on the most recent Mortgage that was taken out on this home.Map
Property Details
Home Type
Condominium
Est. Annual Taxes
$3,915
Year Built
1920
Lot Details
0
Listing Details
- Unit Level: 3
- Unit Placement: Upper
- Property Type: Condominium/Co-Op
- CC Type: Condo
- Style: 2/3 Family
- Other Agent: 3.00
- Lead Paint: Unknown
- Year Built Description: Approximate
- Special Features: 20
- Property Sub Type: Condos
- Year Built: 1920
Interior Features
- Has Basement: Yes
- Number of Rooms: 5
- Amenities: Public Transportation, Shopping, T-Station
- No Bedrooms: 2
- Full Bathrooms: 1
- No Living Levels: 1
- Main Lo: C64900
- Main So: C64900
Exterior Features
- Construction: Frame
- Waterview Flag: Yes
Garage/Parking
- Parking Spaces: 1
Utilities
- Sewer: City/Town Sewer
- Water: City/Town Water
Condo/Co-op/Association
- Association Fee Includes: Master Insurance
- No Units: 3
- Unit Building: C
Lot Info
- Zoning: Res
Home Values in the Area
Average Home Value in this Area
Purchase History
| Date | Type | Sale Price | Title Company |
|---|---|---|---|
| Not Resolvable | $255,000 | -- | |
| Deed | -- | -- | |
| Not Resolvable | $137,500 | -- | |
| Foreclosure Deed | $153,283 | -- | |
| Deed | $155,000 | -- |
Mortgage History
| Date | Status | Loan Amount | Loan Type |
|---|---|---|---|
| Open | $191,250 | New Conventional | |
| Previous Owner | $137,000 | New Conventional | |
| Previous Owner | $200,000 | No Value Available | |
| Previous Owner | $124,000 | Purchase Money Mortgage | |
| Previous Owner | $57,100 | No Value Available |
Property History
| Date | Event | Price | Change | Sq Ft Price |
|---|---|---|---|---|
| 06/27/2019 06/27/19 | Sold | $255,000 | +2.0% | $262 / Sq Ft |
| 05/08/2019 05/08/19 | Pending | -- | -- | -- |
| 05/03/2019 05/03/19 | Price Changed | $249,900 | -7.4% | $257 / Sq Ft |
| 04/18/2019 04/18/19 | Price Changed | $269,900 | -6.3% | $278 / Sq Ft |
| 03/30/2019 03/30/19 | For Sale | $288,000 | +109.5% | $296 / Sq Ft |
| 05/31/2017 05/31/17 | Sold | $137,500 | 0.0% | $141 / Sq Ft |
| 04/20/2017 04/20/17 | Pending | -- | -- | -- |
| 03/14/2017 03/14/17 | For Sale | $137,500 | 0.0% | $141 / Sq Ft |
| 03/02/2017 03/02/17 | Pending | -- | -- | -- |
| 02/27/2017 02/27/17 | For Sale | $137,500 | 0.0% | $141 / Sq Ft |
| 02/23/2017 02/23/17 | Off Market | $137,500 | -- | -- |
| 02/02/2017 02/02/17 | Price Changed | $137,500 | 0.0% | $141 / Sq Ft |
| 02/02/2017 02/02/17 | For Sale | $137,500 | 0.0% | $141 / Sq Ft |
| 01/25/2017 01/25/17 | Off Market | $137,500 | -- | -- |
| 12/20/2016 12/20/16 | Price Changed | $144,800 | -10.0% | $149 / Sq Ft |
| 11/19/2016 11/19/16 | For Sale | $160,900 | 0.0% | $166 / Sq Ft |
| 11/17/2016 11/17/16 | Pending | -- | -- | -- |
| 11/07/2016 11/07/16 | For Sale | $160,900 | -- | $166 / Sq Ft |
Tax History
| Year | Tax Paid | Tax Assessment Tax Assessment Total Assessment is a certain percentage of the fair market value that is determined by local assessors to be the total taxable value of land and additions on the property. | Land | Improvement |
|---|---|---|---|---|
| 2025 | $3,915 | $345,200 | $0 | $345,200 |
| 2024 | $3,814 | $328,200 | $0 | $328,200 |
| 2023 | $3,634 | $290,500 | $0 | $290,500 |
| 2022 | $3,523 | $265,900 | $0 | $265,900 |
| 2021 | $3,649 | $264,400 | $0 | $264,400 |
| 2020 | $3,602 | $249,300 | $0 | $249,300 |
| 2019 | $3,629 | $240,300 | $0 | $240,300 |
| 2018 | $3,370 | $219,100 | $0 | $219,100 |
| 2017 | $3,304 | $208,300 | $0 | $208,300 |
| 2016 | $3,126 | $199,500 | $0 | $199,500 |
| 2015 | $3,129 | $190,700 | $0 | $190,700 |
Source: MLS Property Information Network (MLS PIN)
MLS Number: 72090743
APN: SALE-000033-000000-000577-000803-000803
Disclaimer: Certain information contained herein is derived from information provided by parties other than Homes.com. All information provided is deemed reliable, but is not guaranteed to be accurate and should be independently verified.
![]() The property listing data and information, or the Images, set forth herein were provided to MLS Property Information Network, Inc. from third party sources, including sellers, lessors and public records, and were compiled by MLS Property Information Network, Inc. The property listing data and information, and the Images, are for the personal, non-commercial use of consumers having a good faith interest in purchasing or leasing listed properties of the type displayed to them and may not be used for any purpose other than to identify prospective properties which such consumers may have a good faith interest in purchasing or leasing. MLS Property Information Network, Inc. and its subscribers disclaim any and all representations and warranties as to the accuracy of the property listing data and information, or as to the accuracy of any of the Images, set forth herein.
The property listing data and information, or the Images, set forth herein were provided to MLS Property Information Network, Inc. from third party sources, including sellers, lessors and public records, and were compiled by MLS Property Information Network, Inc. The property listing data and information, and the Images, are for the personal, non-commercial use of consumers having a good faith interest in purchasing or leasing listed properties of the type displayed to them and may not be used for any purpose other than to identify prospective properties which such consumers may have a good faith interest in purchasing or leasing. MLS Property Information Network, Inc. and its subscribers disclaim any and all representations and warranties as to the accuracy of the property listing data and information, or as to the accuracy of any of the Images, set forth herein.
- 71 Leach St Unit 3
- 10 Eden St
- 101 Leach St Unit 3
- 245 Lafayette St Unit 1F
- 275 Lafayette St
- 5 Gardner St Unit 2
- 3 Hazel St
- 1 Shore Ave
- 2A Hazel St Unit 3
- 44 Pingree St Unit 3
- 41 Salem St
- 26 Linden St
- 24 Cabot St Unit 1
- 6R Hazel Terrace Unit 8
- 69 Harbor St
- 33 Harbor St
- 11 Ropes St
- 18 Ropes St Unit 1L
- 16 Loring Ave
- 80 Wharf St Unit K3