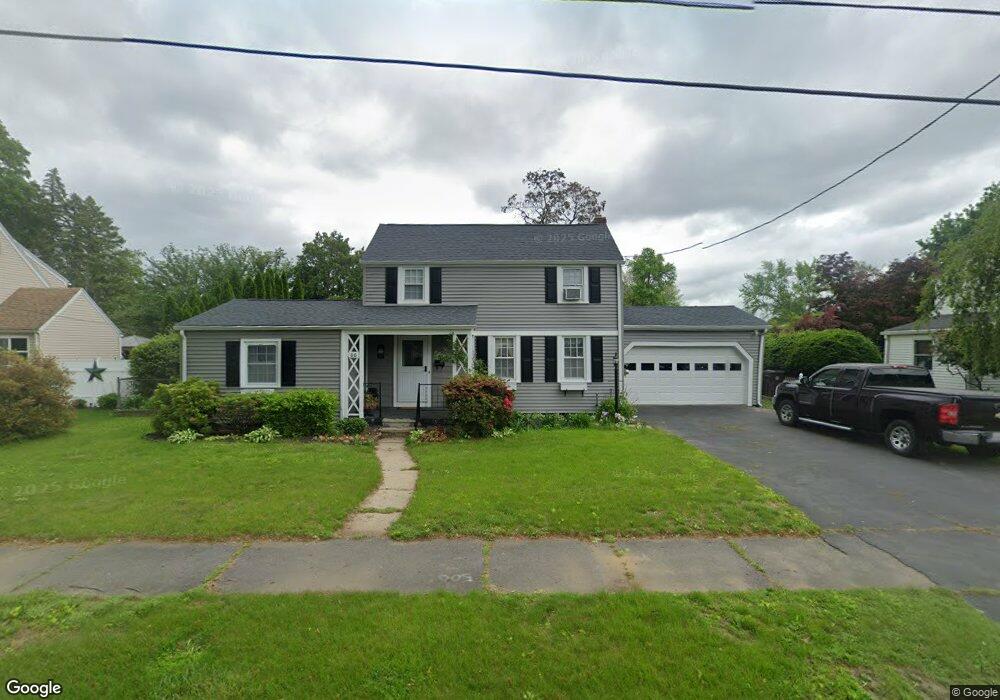
66 Lindbergh Blvd Westfield, MA 01085
Estimated Value: $319,988 - $385,000
3
Beds
2
Baths
1,518
Sq Ft
$227/Sq Ft
Est. Value
About This Home
This home is located at 66 Lindbergh Blvd, Westfield, MA 01085 and is currently estimated at $344,247, approximately $226 per square foot. 66 Lindbergh Blvd is a home located in Hampden County with nearby schools including Westfield High School and Saint Mary High School.
Ownership History
Date
Name
Owned For
Owner Type
Purchase Details
Closed on
Sep 19, 1996
Sold by
Olson Chester W and Olson Carole A
Bought by
Frasco Ronald A and Frasco Jean T
Current Estimated Value
Home Financials for this Owner
Home Financials are based on the most recent Mortgage that was taken out on this home.
Original Mortgage
$75,000
Outstanding Balance
$6,264
Interest Rate
7.89%
Mortgage Type
Purchase Money Mortgage
Estimated Equity
$337,983
Create a Home Valuation Report for This Property
The Home Valuation Report is an in-depth analysis detailing your home's value as well as a comparison with similar homes in the area
Home Values in the Area
Average Home Value in this Area
Purchase History
| Date | Buyer | Sale Price | Title Company |
|---|---|---|---|
| Frasco Ronald A | $115,000 | -- |
Source: Public Records
Mortgage History
| Date | Status | Borrower | Loan Amount |
|---|---|---|---|
| Open | Frasco Ronald A | $25,000 | |
| Open | Frasco Ronald A | $75,000 | |
| Previous Owner | Frasco Ronald A | $90,000 |
Source: Public Records
Tax History
| Year | Tax Paid | Tax Assessment Tax Assessment Total Assessment is a certain percentage of the fair market value that is determined by local assessors to be the total taxable value of land and additions on the property. | Land | Improvement |
|---|---|---|---|---|
| 2025 | $3,994 | $263,100 | $97,600 | $165,500 |
| 2024 | $3,849 | $241,000 | $88,800 | $152,200 |
| 2023 | $3,556 | $218,500 | $84,600 | $133,900 |
| 2022 | $3,556 | $192,300 | $75,400 | $116,900 |
| 2021 | $3,425 | $181,400 | $71,200 | $110,200 |
| 2020 | $2,561 | $173,100 | $71,200 | $101,900 |
| 2019 | $2,522 | $164,800 | $67,900 | $96,900 |
| 2018 | $2,448 | $164,800 | $67,900 | $96,900 |
| 2017 | $3,154 | $162,400 | $68,800 | $93,600 |
| 2016 | $3,157 | $162,400 | $68,800 | $93,600 |
| 2015 | $3,011 | $162,400 | $68,800 | $93,600 |
| 2014 | $2,249 | $162,400 | $68,800 | $93,600 |
Source: Public Records
Map
Nearby Homes
- 72 Lindbergh Blvd
- 60 Lindbergh Blvd
- 78 Lindbergh Blvd
- 54 Lindbergh Blvd
- 65 Lindbergh Blvd
- 71 Lindbergh Blvd
- 59 Lindbergh Blvd
- 84 Lindbergh Blvd
- 77 Lindbergh Blvd
- 46 Lindbergh Blvd
- 47 Lindbergh Blvd
- 83 Lindbergh Blvd
- 90 Lindbergh Blvd
- 38 Lindbergh Blvd
- 89 Lindbergh Blvd
- 39 Lindbergh Blvd
- 96 Lindbergh Blvd
- 96 Lindbergh Blvd
- 95 Lindbergh Blvd
- 95 Lindbergh Blvd Unit 1
Your Personal Tour Guide
Ask me questions while you tour the home.