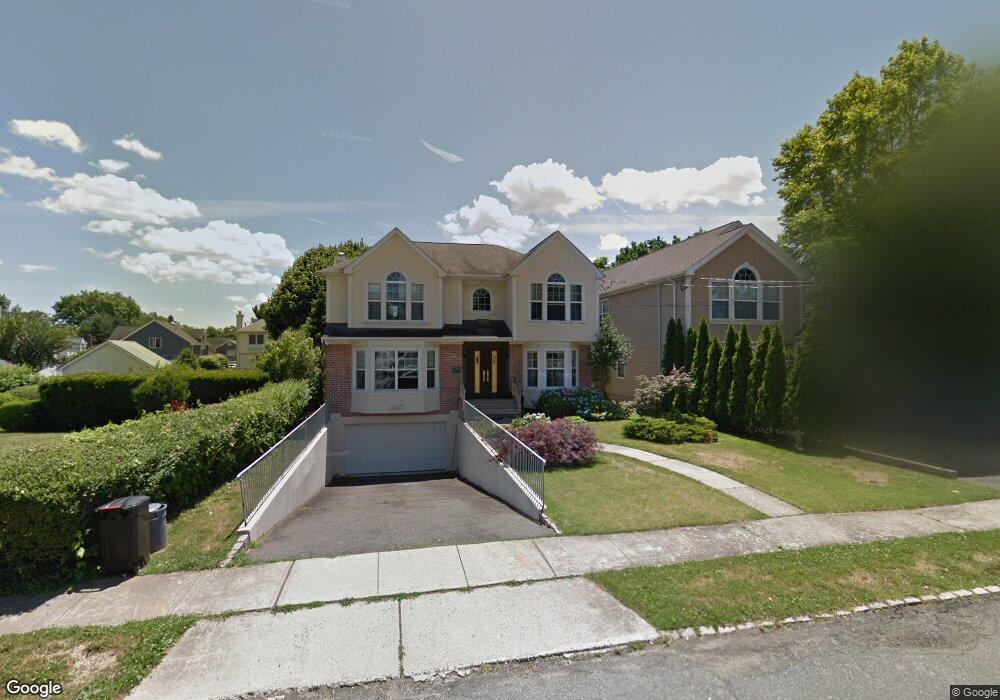
66 Maple St Roslyn Heights, NY 11577
Estimated Value: $1,206,000 - $1,425,672
Studio
3
Baths
2,796
Sq Ft
$471/Sq Ft
Est. Value
About This Home
This home is located at 66 Maple St, Roslyn Heights, NY 11577 and is currently estimated at $1,315,836, approximately $470 per square foot. 66 Maple St is a home located in Nassau County with nearby schools including Roslyn Middle School, Roslyn High School, and Henry Viscardi School.
Ownership History
Date
Name
Owned For
Owner Type
Purchase Details
Closed on
May 18, 2025
Sold by
Shimunova Liana and Iskhakov Robert
Bought by
Shimounova Liana and Iskhakov Robert
Current Estimated Value
Purchase Details
Closed on
Apr 30, 2015
Sold by
Amin Alkesh and Amin Vaishali
Bought by
Aryeh Soleyman
Home Financials for this Owner
Home Financials are based on the most recent Mortgage that was taken out on this home.
Original Mortgage
$500,000
Outstanding Balance
$383,091
Interest Rate
3.69%
Mortgage Type
New Conventional
Estimated Equity
$932,745
Purchase Details
Closed on
Aug 1, 2012
Sold by
Amin Alkesh and Amin Vaishali
Bought by
Roslyn Maple Llc
Purchase Details
Closed on
Nov 8, 2010
Sold by
Amin Alkesh
Bought by
Amin Alkesh and Amin Vaishali
Purchase Details
Closed on
Aug 16, 2001
Sold by
Estate-Stabasefski Thomas
Bought by
Amin Alkesh
Create a Home Valuation Report for This Property
The Home Valuation Report is an in-depth analysis detailing your home's value as well as a comparison with similar homes in the area
Home Values in the Area
Average Home Value in this Area
Purchase History
| Date | Buyer | Sale Price | Title Company |
|---|---|---|---|
| Shimounova Liana | -- | Your Title Experts | |
| Aryeh Soleyman | $850,000 | None Available | |
| Aryeh Soleyman | $850,000 | None Available | |
| Aryeh Soleyman | $850,000 | None Available | |
| Aryeh Soleyman | $850,000 | None Available | |
| Roslyn Maple Llc | -- | -- | |
| Roslyn Maple Llc | -- | -- | |
| Roslyn Maple Llc | -- | -- | |
| Amin Alkesh | -- | -- | |
| Amin Alkesh | -- | -- | |
| Amin Alkesh | -- | -- | |
| Amin Alkesh | $661,500 | Jack Martins | |
| Amin Alkesh | $661,500 | Jack Martins |
Source: Public Records
Mortgage History
| Date | Status | Borrower | Loan Amount |
|---|---|---|---|
| Open | Aryeh Soleyman | $500,000 | |
| Closed | Aryeh Soleyman | $500,000 |
Source: Public Records
Tax History
| Year | Tax Paid | Tax Assessment Tax Assessment Total Assessment is a certain percentage of the fair market value that is determined by local assessors to be the total taxable value of land and additions on the property. | Land | Improvement |
|---|---|---|---|---|
| 2025 | $23,374 | $990 | $248 | $742 |
| 2024 | $5,742 | $1,060 | $265 | $795 |
Source: Public Records
Map
Nearby Homes
- 29 Garfield Place
- 97 Burnham Ave
- 142 Willow St
- 163 Elm St
- 16 Pony Cir
- 99 Warner Ave
- 17 the Intervale
- 5 Hillside Ave
- 198 Warner Ave
- 16 Edwards St Unit 3G
- 8 Junard Dr
- 2 Edwards St Unit 3D
- 12 Edwards St Unit 3B
- 3 Edwards St Unit 1G
- 97 Gilmar Ln
- 44 Edwards St Unit 1A
- 7 Edwards St Unit 2G
- 39 Hillturn Ln
- 23 Harvard St
- 11 Dicks Ln
Your Personal Tour Guide
Ask me questions while you tour the home.