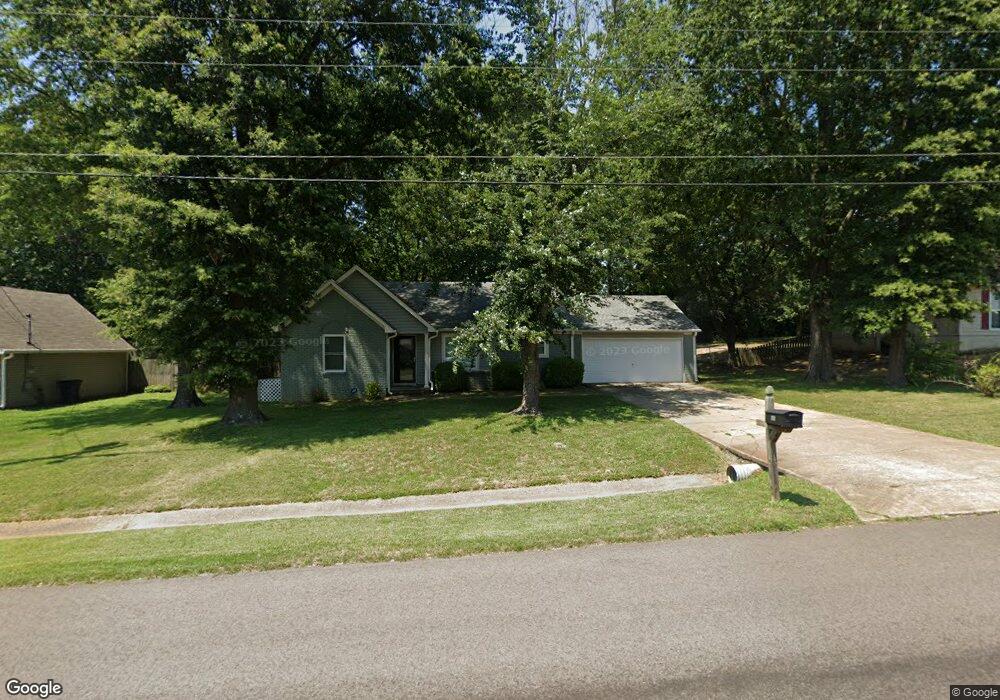
66 McGee Loop Jackson, TN 38305
Estimated Value: $164,311 - $206,000
Studio
2
Baths
1,478
Sq Ft
$128/Sq Ft
Est. Value
About This Home
This home is located at 66 McGee Loop, Jackson, TN 38305 and is currently estimated at $189,328, approximately $128 per square foot. 66 McGee Loop is a home located in Madison County with nearby schools including East Elementary School, Northeast Middle School, and North Side High School.
Ownership History
Date
Name
Owned For
Owner Type
Purchase Details
Closed on
Jul 12, 2004
Sold by
Emree Group Lp
Bought by
Alicia Hoyle
Current Estimated Value
Home Financials for this Owner
Home Financials are based on the most recent Mortgage that was taken out on this home.
Original Mortgage
$66,400
Outstanding Balance
$31,679
Interest Rate
5.75%
Estimated Equity
$157,649
Purchase Details
Closed on
Apr 15, 2004
Sold by
Wilson Robert M Jr Suc Tr
Bought by
Emree Group
Purchase Details
Closed on
Aug 2, 2000
Bought by
Boyd Maurice and Boyd Onya
Purchase Details
Closed on
Apr 26, 2000
Sold by
Riggs Dustin G
Bought by
Norwest Mortg Inc
Purchase Details
Closed on
Dec 17, 1998
Sold by
Riggs Dustin G
Bought by
Riggs Dustin G
Purchase Details
Closed on
Jul 29, 1991
Bought by
Johnson Robert R
Purchase Details
Closed on
Jul 9, 1986
Bought by
Canada David A
Purchase Details
Closed on
Jan 9, 1986
Purchase Details
Closed on
Aug 9, 1985
Create a Home Valuation Report for This Property
The Home Valuation Report is an in-depth analysis detailing your home's value as well as a comparison with similar homes in the area
Purchase History
| Date | Buyer | Sale Price | Title Company |
|---|---|---|---|
| Alicia Hoyle | $83,000 | -- | |
| Emree Group | $65,218 | -- | |
| Boyd Maurice | $77,500 | -- | |
| Norwest Mortg Inc | $86,374 | -- | |
| Riggs Dustin G | $78,000 | -- | |
| Johnson Robert R | $64,600 | -- | |
| Canada David A | -- | -- | |
| -- | -- | -- | |
| -- | -- | -- |
Source: Public Records
Mortgage History
| Date | Status | Borrower | Loan Amount |
|---|---|---|---|
| Open | Not Available | $66,400 | |
| Closed | Not Available | $16,600 |
Source: Public Records
Tax History
| Year | Tax Paid | Tax Assessment Tax Assessment Total Assessment is a certain percentage of the fair market value that is determined by local assessors to be the total taxable value of land and additions on the property. | Land | Improvement |
|---|---|---|---|---|
| 2025 | $719 | $38,375 | $5,000 | $33,375 |
| 2024 | $719 | $38,375 | $5,000 | $33,375 |
| 2022 | $719 | $38,375 | $5,000 | $33,375 |
| 2021 | $506 | $21,525 | $3,150 | $18,375 |
| 2020 | $506 | $21,525 | $3,150 | $18,375 |
| 2019 | $506 | $21,525 | $3,150 | $18,375 |
| 2018 | $506 | $21,525 | $3,150 | $18,375 |
| 2017 | $519 | $21,175 | $3,150 | $18,025 |
| 2016 | $455 | $21,175 | $3,150 | $18,025 |
| 2015 | $455 | $21,175 | $3,150 | $18,025 |
| 2014 | $457 | $21,250 | $3,150 | $18,100 |
Source: Public Records
Map
Nearby Homes
- 91 McGee Loop
- 99 Hidden Valley Dr
- 24 Palmetto Cove
- 0 Interstate 40 Unit 2505648
- 0 Interstate 40
- 0 U S Highway 412
- 111 Henderson Rd
- 0 Red Gum Ln & Old Medina Crossing Ln Unit 10195533
- 21 Bluebird Cove
- 2888 Old Medina Rd
- 85 Old Medina Crossing
- 31 Mack St
- 189 Valley Oak Loop
- 41 International Cove
- 20 Bink Dr
- 62 Beth Place
- 34 Baymeadows Dr
- 00 Chloe Place
- 53 Jackson Creek Dr
- 78 Candlewick Dr
- 74 McGee Loop
- 50 McGee Loop
- 82 McGee Loop
- 82 Jeremy Dr
- 75 McGee Loop
- 42 McGee Loop
- 90 McGee Loop
- 51 McGee Loop
- 83 McGee Loop
- 71 Jeremy Dr
- 43 McGee Loop
- 58 Hidden Valley Dr
- 98 McGee Loop
- 74 Hidden Valley Dr
- 50 Hidden Valley Dr
- 82 Hidden Valley Dr
- 35 McGee Loop
- 42 Hidden Valley Dr
- 99 McGee Loop
- 26 McGee Loop
Your Personal Tour Guide
Ask me questions while you tour the home.