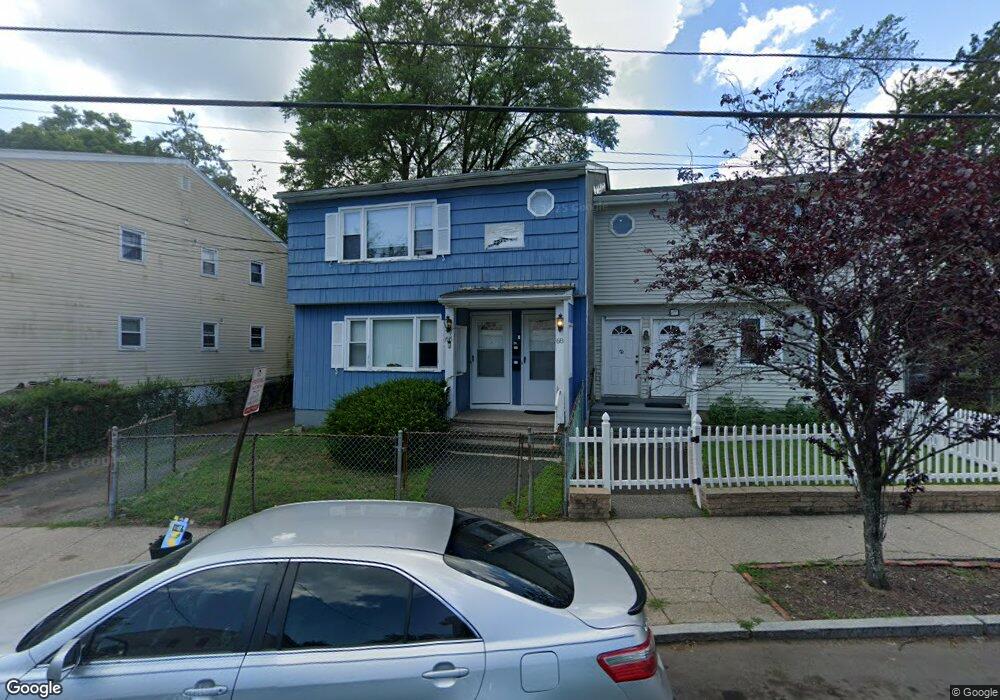
66 Monroe St New Haven, CT 06513
Fair Haven NeighborhoodEstimated Value: $339,863 - $426,000
6
Beds
2
Baths
2,064
Sq Ft
$177/Sq Ft
Est. Value
About This Home
This home is located at 66 Monroe St, New Haven, CT 06513 and is currently estimated at $365,966, approximately $177 per square foot. 66 Monroe St is a home located in New Haven County with nearby schools including Clinton Avenue School, Elm City College Preparatory School, and Booker T. Washington Academy.
Ownership History
Date
Name
Owned For
Owner Type
Purchase Details
Closed on
Feb 23, 2022
Sold by
Netz Bonds New Haven 2
Bought by
Netz Consolidated Llc
Current Estimated Value
Purchase Details
Closed on
Oct 1, 2014
Sold by
First Niagara Bank Na
Bought by
Netz Bonds New Haven 2
Purchase Details
Closed on
May 28, 2014
Sold by
Campbell Andrea D
Bought by
First Niagara Bank Na
Purchase Details
Closed on
May 3, 2007
Sold by
Howie Carolyn
Bought by
Campbell Andrea
Home Financials for this Owner
Home Financials are based on the most recent Mortgage that was taken out on this home.
Original Mortgage
$184,300
Interest Rate
5.75%
Create a Home Valuation Report for This Property
The Home Valuation Report is an in-depth analysis detailing your home's value as well as a comparison with similar homes in the area
Home Values in the Area
Average Home Value in this Area
Purchase History
| Date | Buyer | Sale Price | Title Company |
|---|---|---|---|
| Netz Consolidated Llc | -- | None Available | |
| Netz Bonds New Haven 2 | $60,000 | -- | |
| First Niagara Bank Na | -- | -- | |
| Campbell Andrea | $190,000 | -- |
Source: Public Records
Mortgage History
| Date | Status | Borrower | Loan Amount |
|---|---|---|---|
| Previous Owner | Campbell Andrea | $184,300 | |
| Previous Owner | Campbell Andrea | $10,000 | |
| Previous Owner | Campbell Andrea | $5,000 | |
| Previous Owner | Campbell Andrea | $76,500 |
Source: Public Records
Tax History Compared to Growth
Tax History
| Year | Tax Paid | Tax Assessment Tax Assessment Total Assessment is a certain percentage of the fair market value that is determined by local assessors to be the total taxable value of land and additions on the property. | Land | Improvement |
|---|---|---|---|---|
| 2025 | $6,012 | $152,600 | $27,440 | $125,160 |
| 2024 | $5,875 | $152,600 | $27,440 | $125,160 |
| 2023 | $5,677 | $152,600 | $27,440 | $125,160 |
| 2022 | $6,066 | $152,600 | $27,440 | $125,160 |
| 2021 | $4,325 | $98,560 | $21,980 | $76,580 |
| 2020 | $4,325 | $98,560 | $21,980 | $76,580 |
| 2019 | $4,236 | $98,560 | $21,980 | $76,580 |
| 2018 | $4,236 | $98,560 | $21,980 | $76,580 |
| 2017 | $3,812 | $98,560 | $21,980 | $76,580 |
| 2016 | $3,438 | $82,740 | $14,630 | $68,110 |
| 2015 | $3,438 | $82,740 | $14,630 | $68,110 |
| 2014 | $3,438 | $82,740 | $14,630 | $68,110 |
Source: Public Records
Map
Nearby Homes