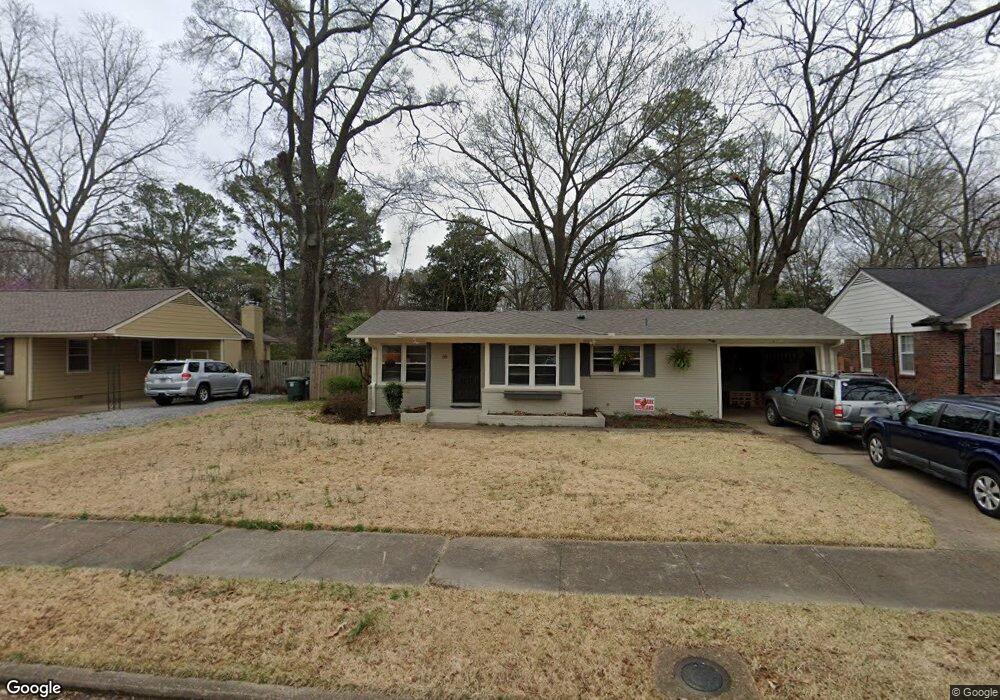
66 N Fernway Rd Memphis, TN 38117
Audubon Park NeighborhoodEstimated Value: $342,618 - $376,000
3
Beds
2
Baths
2,179
Sq Ft
$165/Sq Ft
Est. Value
About This Home
This home is located at 66 N Fernway Rd, Memphis, TN 38117 and is currently estimated at $359,405, approximately $164 per square foot. 66 N Fernway Rd is a home located in Shelby County with nearby schools including White Station Elementary School, White Station High, and White Station Middle.
Ownership History
Date
Name
Owned For
Owner Type
Purchase Details
Closed on
Sep 29, 2016
Sold by
Mendelson Leslie A
Bought by
Moss Brandon Kent and Moss Brenda Jane
Current Estimated Value
Home Financials for this Owner
Home Financials are based on the most recent Mortgage that was taken out on this home.
Original Mortgage
$174,000
Outstanding Balance
$139,361
Interest Rate
3.43%
Mortgage Type
New Conventional
Estimated Equity
$220,044
Purchase Details
Closed on
Mar 30, 2006
Sold by
Mcclain John H
Bought by
Mendelson Leslie A
Home Financials for this Owner
Home Financials are based on the most recent Mortgage that was taken out on this home.
Original Mortgage
$170,000
Interest Rate
6.23%
Mortgage Type
Fannie Mae Freddie Mac
Purchase Details
Closed on
Oct 30, 1998
Sold by
Gerlach Paul A and Gerlach Laidy C
Bought by
Mcclain John H
Home Financials for this Owner
Home Financials are based on the most recent Mortgage that was taken out on this home.
Original Mortgage
$125,000
Interest Rate
6.65%
Create a Home Valuation Report for This Property
The Home Valuation Report is an in-depth analysis detailing your home's value as well as a comparison with similar homes in the area
Home Values in the Area
Average Home Value in this Area
Purchase History
| Date | Buyer | Sale Price | Title Company |
|---|---|---|---|
| Moss Brandon Kent | $217,500 | Realty Title | |
| Mendelson Leslie A | $212,500 | None Available | |
| Mcclain John H | $147,500 | -- |
Source: Public Records
Mortgage History
| Date | Status | Borrower | Loan Amount |
|---|---|---|---|
| Open | Moss Brandon Kent | $174,000 | |
| Previous Owner | Mendelson Leslie A | $170,000 | |
| Previous Owner | Mcclain John H | $125,000 |
Source: Public Records
Tax History Compared to Growth
Tax History
| Year | Tax Paid | Tax Assessment Tax Assessment Total Assessment is a certain percentage of the fair market value that is determined by local assessors to be the total taxable value of land and additions on the property. | Land | Improvement |
|---|---|---|---|---|
| 2025 | $2,398 | $77,575 | $18,325 | $59,250 |
| 2024 | $2,398 | $70,750 | $19,325 | $51,425 |
| 2023 | $4,310 | $70,750 | $19,325 | $51,425 |
| 2022 | $4,310 | $70,750 | $19,325 | $51,425 |
| 2021 | $4,554 | $76,375 | $19,325 | $57,050 |
| 2020 | $3,835 | $52,925 | $19,325 | $33,600 |
| 2019 | $3,835 | $52,925 | $19,325 | $33,600 |
| 2018 | $3,835 | $52,925 | $19,325 | $33,600 |
| 2017 | $2,175 | $52,925 | $19,325 | $33,600 |
| 2016 | $2,101 | $48,075 | $0 | $0 |
| 2014 | $2,101 | $48,075 | $0 | $0 |
Source: Public Records
Map
Nearby Homes
- 5068 Walnut Grove Rd
- 50 Grove Creek Place
- 65 Laverne Ln
- 4975 Brookwood Cove
- 5157 S Angela Rd
- 5071 Anchor Cove
- 5188 Gwynne Rd
- 41 W Bendel Cir
- 5103 Norich Ave
- 4859 Gwynne Rd
- 267 Barry Rd
- 264 Barry Rd
- 4956 Robindale Ln
- 5264 S Angela Rd
- 5081 Rich Rd
- 5094 Cole Rd
- 131 N Mendenhall Rd
- 125 W Bendel Cir
- 5055 Greenway Rd
- 4980 Barfield Rd
- 66 N Fernway Rd
- 66 S Fernway Dr
- 66 S Fernway Rd
- 56 S Fernway Rd
- 76 S Fernway Dr
- 84 S Fernway Dr
- 46 S Fernway Dr
- 61 W Carlos Rd
- 69 W Carlos Rd
- 46 S Fernway Rd
- 69 S Fernway Rd
- 69 S Fernway Dr
- 79 W Carlos Rd
- 51 W Carlos Rd
- 57 S Fernway Dr
- 79 S Fernway Dr
- 36 S Fernway Dr
- 47 S Fernway Rd
- 43 W Carlos Rd
- 92 S Fernway Dr