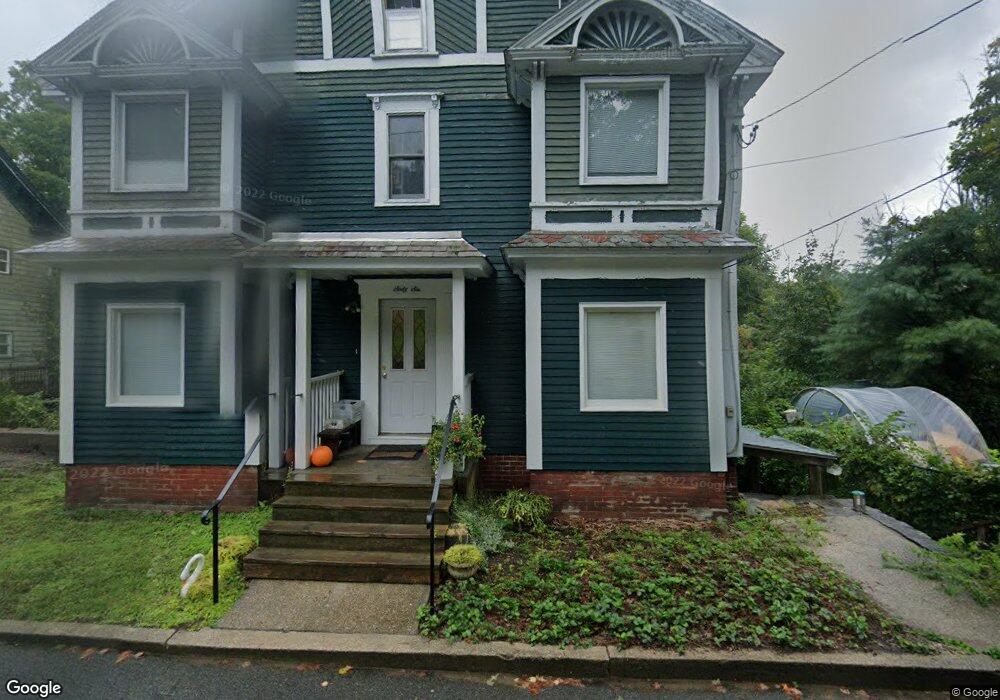
66 N Main St Orange, MA 01364
Estimated Value: $238,000 - $331,000
6
Beds
2
Baths
2,624
Sq Ft
$109/Sq Ft
Est. Value
About This Home
This home is located at 66 N Main St, Orange, MA 01364 and is currently estimated at $285,260, approximately $108 per square foot. 66 N Main St is a home located in Franklin County with nearby schools including Fisher Hill and Ralph C Mahar Regional School.
Ownership History
Date
Name
Owned For
Owner Type
Purchase Details
Closed on
Aug 25, 2011
Sold by
Beneficial Massachuset
Bought by
Macdonald Victor G and Macdonald Laurie J
Current Estimated Value
Purchase Details
Closed on
Jun 23, 2011
Sold by
Dike Glen A
Bought by
Beneficial Mass Inc
Purchase Details
Closed on
Mar 26, 2002
Sold by
Rau Tr Douglas K and Rau Narliese G
Bought by
Dike Glen A
Home Financials for this Owner
Home Financials are based on the most recent Mortgage that was taken out on this home.
Original Mortgage
$17,500
Interest Rate
6.84%
Purchase Details
Closed on
Sep 20, 1993
Sold by
Shawmut Bk Na
Bought by
66-68 North Main St T and Raw Douglas K
Create a Home Valuation Report for This Property
The Home Valuation Report is an in-depth analysis detailing your home's value as well as a comparison with similar homes in the area
Home Values in the Area
Average Home Value in this Area
Purchase History
| Date | Buyer | Sale Price | Title Company |
|---|---|---|---|
| Macdonald Victor G | $24,577 | -- | |
| Beneficial Mass Inc | $24,466 | -- | |
| Dike Glen A | $116,900 | -- | |
| 66-68 North Main St T | $12,500 | -- |
Source: Public Records
Mortgage History
| Date | Status | Borrower | Loan Amount |
|---|---|---|---|
| Previous Owner | 66-68 North Main St T | $140,163 | |
| Previous Owner | 66-68 North Main St T | $17,500 | |
| Previous Owner | 66-68 North Main St T | $99,365 |
Source: Public Records
Tax History Compared to Growth
Tax History
| Year | Tax Paid | Tax Assessment Tax Assessment Total Assessment is a certain percentage of the fair market value that is determined by local assessors to be the total taxable value of land and additions on the property. | Land | Improvement |
|---|---|---|---|---|
| 2025 | $35 | $213,000 | $22,300 | $190,700 |
| 2024 | $3,326 | $190,700 | $22,300 | $168,400 |
| 2023 | $3,301 | $183,800 | $20,000 | $163,800 |
| 2022 | $3,034 | $158,700 | $20,000 | $138,700 |
| 2021 | $2,482 | $123,800 | $35,400 | $88,400 |
| 2020 | $2,112 | $103,900 | $32,300 | $71,600 |
| 2019 | $2,049 | $91,000 | $27,900 | $63,100 |
| 2018 | $2,054 | $93,600 | $26,100 | $67,500 |
| 2017 | $1,987 | $93,600 | $26,100 | $67,500 |
| 2016 | $1,777 | $81,900 | $23,300 | $58,600 |
| 2015 | $1,981 | $95,400 | $24,800 | $70,600 |
| 2014 | $2,321 | $117,600 | $24,800 | $92,800 |
Source: Public Records
Map
Nearby Homes
- 36 Summit St Unit A
- 36 Summit St Unit B
- 12-14 E Main St
- 50 E Main St
- 52 Mechanic St
- 43 W Main St
- 102 Mechanic St
- 89 W Main St
- 140 Mechanic St
- 35 W River St
- 150 E Main St
- 166-168 W Main St
- 114 S Main St
- 27 Chase St
- 222 W River St
- 121 Pleasant St
- 257 S Main St
- 490 S Main St
- 0 Oxbow Unit 73446570
- 00 S Main St