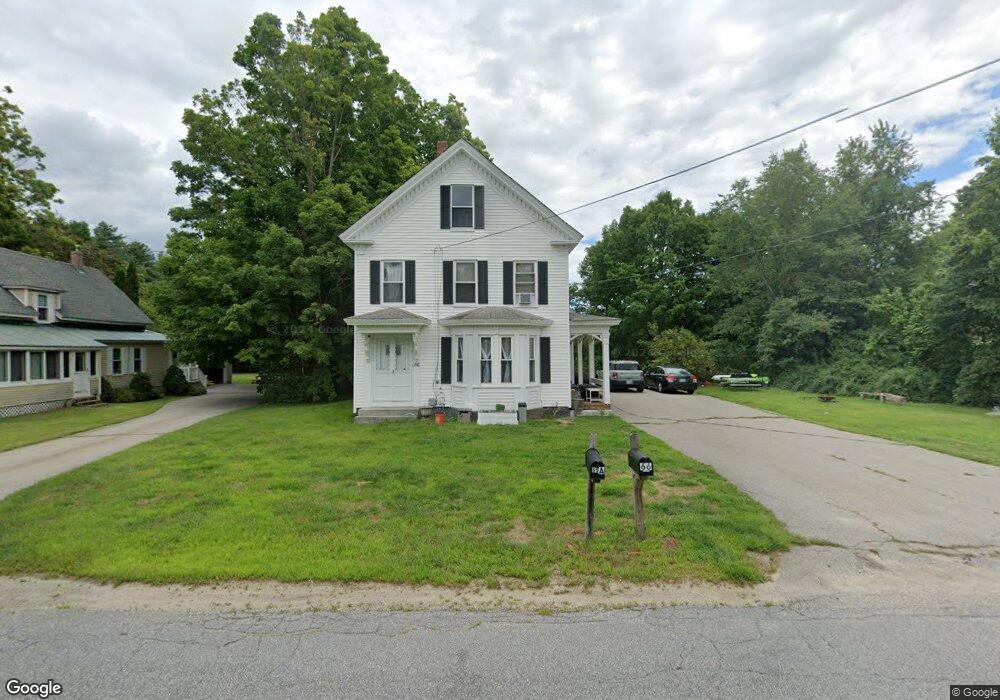
66 Packers Falls Rd Newmarket, NH 03857
Estimated Value: $631,000 - $687,000
4
Beds
2
Baths
2,867
Sq Ft
$229/Sq Ft
Est. Value
About This Home
This home is located at 66 Packers Falls Rd, Newmarket, NH 03857 and is currently estimated at $656,993, approximately $229 per square foot. 66 Packers Falls Rd is a home located in Rockingham County with nearby schools including Newmarket Elementary School, Newmarket Junior High School, and Newmarket Senior High School.
Ownership History
Date
Name
Owned For
Owner Type
Purchase Details
Closed on
Feb 4, 2021
Sold by
Judy Archambeault Ret
Bought by
Archambeault Judy
Current Estimated Value
Purchase Details
Closed on
May 16, 2008
Sold by
Us Bank Na
Bought by
Archambeault Judy A
Purchase Details
Closed on
Feb 28, 2008
Sold by
Pouliot Richard P
Bought by
Us Bank Na
Purchase Details
Closed on
Mar 17, 2005
Sold by
Delintsiotis Anthi
Bought by
Pouliot Richard P
Home Financials for this Owner
Home Financials are based on the most recent Mortgage that was taken out on this home.
Original Mortgage
$399,000
Interest Rate
5.64%
Mortgage Type
Purchase Money Mortgage
Purchase Details
Closed on
Jun 30, 2000
Sold by
Murray Brian S
Bought by
Delintsiotis Anthi
Home Financials for this Owner
Home Financials are based on the most recent Mortgage that was taken out on this home.
Original Mortgage
$194,177
Interest Rate
8.59%
Create a Home Valuation Report for This Property
The Home Valuation Report is an in-depth analysis detailing your home's value as well as a comparison with similar homes in the area
Home Values in the Area
Average Home Value in this Area
Purchase History
| Date | Buyer | Sale Price | Title Company |
|---|---|---|---|
| Archambeault Judy | -- | None Available | |
| Archambeault Judy A | $244,000 | -- | |
| Us Bank Na | $288,000 | -- | |
| Pouliot Richard P | $399,000 | -- | |
| Delintsiotis Anthi | $199,900 | -- |
Source: Public Records
Mortgage History
| Date | Status | Borrower | Loan Amount |
|---|---|---|---|
| Previous Owner | Delintsiotis Anthi | $399,000 | |
| Previous Owner | Delintsiotis Anthi | $194,177 |
Source: Public Records
Tax History Compared to Growth
Tax History
| Year | Tax Paid | Tax Assessment Tax Assessment Total Assessment is a certain percentage of the fair market value that is determined by local assessors to be the total taxable value of land and additions on the property. | Land | Improvement |
|---|---|---|---|---|
| 2024 | $10,623 | $617,600 | $259,200 | $358,400 |
| 2023 | $10,484 | $355,500 | $148,200 | $207,300 |
| 2022 | $9,595 | $355,500 | $148,200 | $207,300 |
| 2021 | $9,371 | $355,500 | $148,200 | $207,300 |
| 2020 | $727 | $355,500 | $148,200 | $207,300 |
| 2018 | $7,503 | $256,600 | $87,100 | $169,500 |
| 2017 | $6,859 | $256,600 | $87,100 | $169,500 |
| 2016 | $6,530 | $256,600 | $87,100 | $169,500 |
| 2015 | $6,405 | $256,600 | $87,100 | $169,500 |
| 2014 | $6,607 | $256,600 | $87,100 | $169,500 |
| 2013 | $8,167 | $333,900 | $118,200 | $215,700 |
| 2012 | $7,903 | $333,900 | $118,200 | $215,700 |
Source: Public Records
Map
Nearby Homes
- 2 Chapel St
- 16 Railroad St
- 125 Main St Unit 39
- 13 Moonlight Dr
- 11 Creighton St
- 21 Briallia Cir
- 90 Colgate Rd
- 23 Columbia Dr
- 85 Princeton St
- 16 Bennett Way
- 4 Kelsey Dr
- 5 Langs Ln
- 141 Hersey Ln
- 1 Lee Hook Rd
- 0 Pear Tree Ln Unit 9
- 0 Pear Tree Ln Unit 10
- 10 Merrill Ln
- 325 Lita Ln
- 254 Ash Swamp Rd
- 411 Ash Swamp Rd
- 68 Packers Falls Rd
- 64 Packers Falls Rd
- 70 Packers Falls Rd
- 62 Packers Falls Rd
- 63 Packers Falls Rd
- 72 Packers Falls Rd
- 65 Packers Falls Rd
- 60 Packers Falls Rd
- 74 Packers Falls Rd
- 71 Packers Falls Rd
- 76 Packers Falls Rd
- 59 Packers Falls Rd
- 69A Packers Falls Rd
- 2 Lafayette Rd
- 69 Packers Falls Rd
- 73 Packers Falls Rd
- 1 Lafayette Rd
- 61 Packers Falls Rd
- 3 Lafayette Rd
- 77 Packers Falls Rd