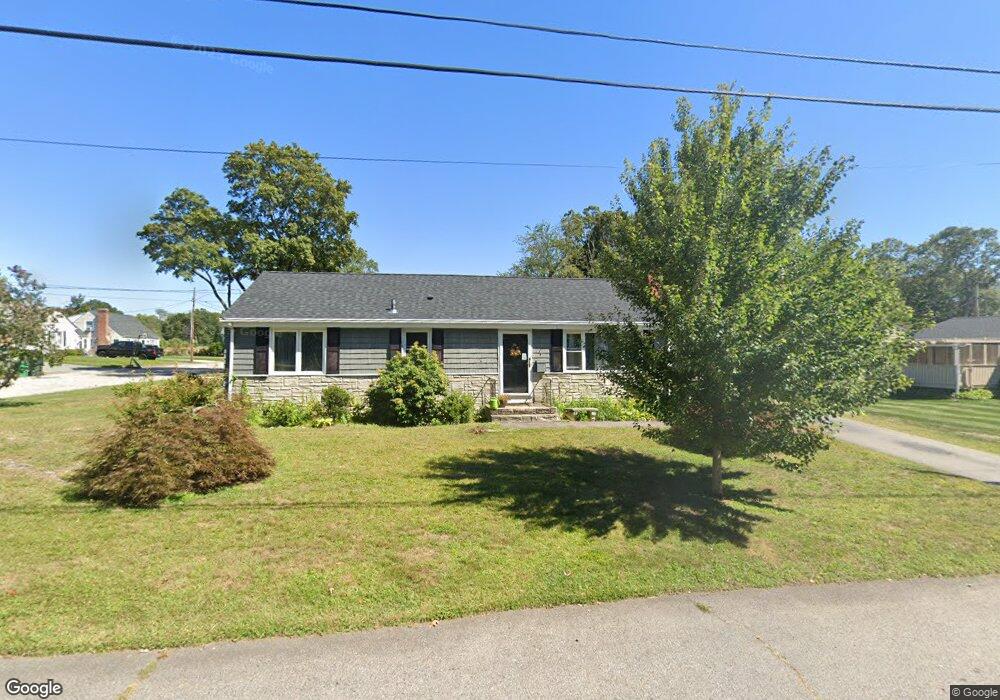
66 Park View Ave Warwick, RI 02888
Lakewood NeighborhoodEstimated Value: $359,616 - $411,000
3
Beds
1
Bath
1,056
Sq Ft
$366/Sq Ft
Est. Value
About This Home
This home is located at 66 Park View Ave, Warwick, RI 02888 and is currently estimated at $386,404, approximately $365 per square foot. 66 Park View Ave is a home located in Kent County with nearby schools including St. Peter School and Saint Paul School.
Ownership History
Date
Name
Owned For
Owner Type
Purchase Details
Closed on
Aug 3, 2020
Sold by
Tourony Bruce
Bought by
Lima Joshua
Current Estimated Value
Purchase Details
Closed on
Apr 30, 2009
Sold by
Us Bank Na
Bought by
Tourony Bruce
Home Financials for this Owner
Home Financials are based on the most recent Mortgage that was taken out on this home.
Original Mortgage
$130,494
Interest Rate
4.86%
Mortgage Type
Purchase Money Mortgage
Purchase Details
Closed on
Apr 4, 2005
Sold by
Ahrendt Walter H Est and Farmer
Bought by
Ahrendt Randy and Webb Melissa
Home Financials for this Owner
Home Financials are based on the most recent Mortgage that was taken out on this home.
Original Mortgage
$182,400
Interest Rate
5.61%
Mortgage Type
Purchase Money Mortgage
Create a Home Valuation Report for This Property
The Home Valuation Report is an in-depth analysis detailing your home's value as well as a comparison with similar homes in the area
Home Values in the Area
Average Home Value in this Area
Purchase History
| Date | Buyer | Sale Price | Title Company |
|---|---|---|---|
| Lima Joshua | -- | None Available | |
| Lima Joshua | -- | None Available | |
| Tourony Bruce | $135,000 | -- | |
| Ahrendt Randy | $228,000 | -- | |
| Tourony Bruce | $135,000 | -- | |
| Ahrendt Randy | $228,000 | -- |
Source: Public Records
Mortgage History
| Date | Status | Borrower | Loan Amount |
|---|---|---|---|
| Previous Owner | Ahrendt Randy | $130,494 | |
| Previous Owner | Ahrendt Randy | $182,400 |
Source: Public Records
Tax History
| Year | Tax Paid | Tax Assessment Tax Assessment Total Assessment is a certain percentage of the fair market value that is determined by local assessors to be the total taxable value of land and additions on the property. | Land | Improvement |
|---|---|---|---|---|
| 2025 | $4,214 | $331,800 | $105,400 | $226,400 |
| 2024 | $3,976 | $274,800 | $91,600 | $183,200 |
| 2023 | $3,821 | $269,300 | $86,100 | $183,200 |
| 2022 | $3,581 | $191,200 | $54,700 | $136,500 |
| 2021 | $3,581 | $191,200 | $54,700 | $136,500 |
| 2020 | $3,581 | $191,200 | $54,700 | $136,500 |
| 2019 | $3,581 | $191,200 | $54,700 | $136,500 |
| 2018 | $2,983 | $147,400 | $54,700 | $92,700 |
| 2017 | $2,983 | $147,400 | $54,700 | $92,700 |
| 2016 | $2,983 | $147,400 | $54,700 | $92,700 |
| 2015 | $2,847 | $137,200 | $53,200 | $84,000 |
| 2014 | $2,752 | $137,200 | $53,200 | $84,000 |
| 2013 | $2,715 | $137,200 | $53,200 | $84,000 |
Source: Public Records
Map
Nearby Homes
- 136 Sherwood Ave
- 120 Sherwood Ave
- 127 Sherwood Ave
- 111 Sherwood Ave
- 171 Sherwood Ave
- 80 George St
- 25 Newfield Ave
- 821 Post Rd
- 0 Elmwood Ave
- 123 Harrington Ave
- 65 Perkins Ave
- 35 Welfare Ave
- 210 Irving Rd
- 94 Holmes Rd
- 129 1st Ave
- 115 Irving Rd
- 1052 Post Rd
- 27 Vickery St
- 27 Frederick St
- 22 Phillips Ave
Your Personal Tour Guide
Ask me questions while you tour the home.