Estimated Value: $822,000 - $1,109,000
4
Beds
3
Baths
2,425
Sq Ft
$380/Sq Ft
Est. Value
About This Home
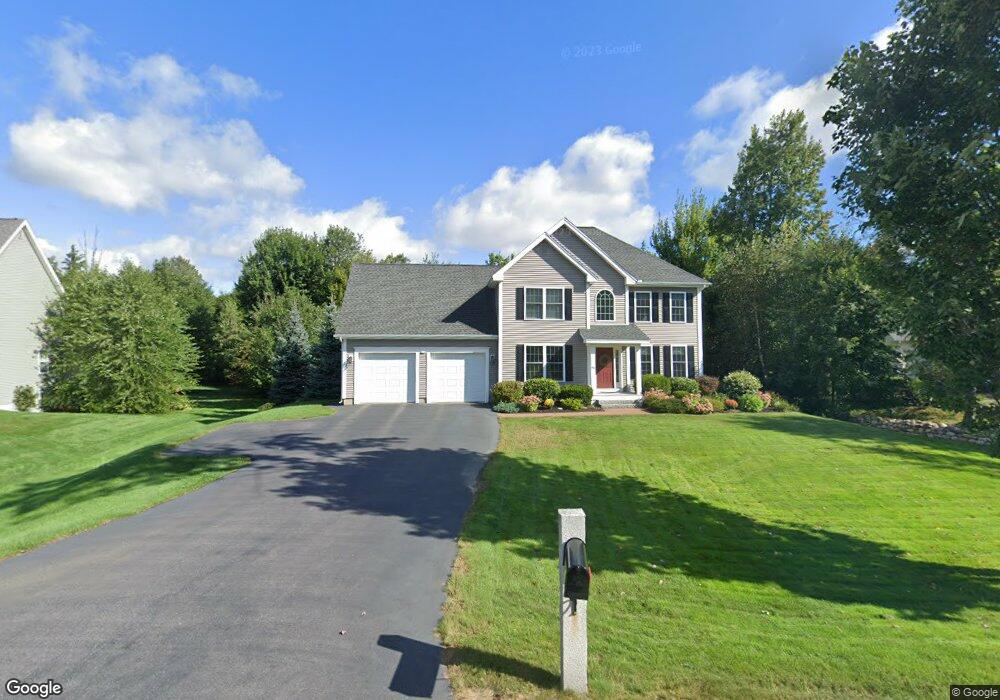
This home is located at 66 Peaslee Rd, Bow, NH 03304 and is currently estimated at $921,917, approximately $380 per square foot. 66 Peaslee Rd is a home with nearby schools including Bow Elementary School, Bow Memorial School, and Bow High School.
Ownership History
Date
Name
Owned For
Owner Type
Purchase Details
Closed on
Aug 26, 2011
Sold by
Peaslee Hill Llc
Bought by
Kelly Sean C and Spain-Kelly Kelly J
Current Estimated Value
Home Financials for this Owner
Home Financials are based on the most recent Mortgage that was taken out on this home.
Original Mortgage
$291,170
Interest Rate
4.53%
Mortgage Type
Purchase Money Mortgage
Create a Home Valuation Report for This Property
The Home Valuation Report is an in-depth analysis detailing your home's value as well as a comparison with similar homes in the area
Home Values in the Area
Average Home Value in this Area
Purchase History
| Date | Buyer | Sale Price | Title Company |
|---|---|---|---|
| Kelly Sean C | $372,200 | -- |
Source: Public Records
Mortgage History
| Date | Status | Borrower | Loan Amount |
|---|---|---|---|
| Open | Kelly Sean C | $309,600 | |
| Closed | Kelly Sean C | $291,170 |
Source: Public Records
Tax History Compared to Growth
Tax History
| Year | Tax Paid | Tax Assessment Tax Assessment Total Assessment is a certain percentage of the fair market value that is determined by local assessors to be the total taxable value of land and additions on the property. | Land | Improvement |
|---|---|---|---|---|
| 2024 | $16,071 | $812,500 | $159,800 | $652,700 |
| 2023 | $13,685 | $492,100 | $113,400 | $378,700 |
| 2022 | $13,050 | $492,100 | $113,400 | $378,700 |
| 2021 | $12,544 | $492,100 | $113,400 | $378,700 |
| 2020 | $12,588 | $492,100 | $113,400 | $378,700 |
| 2019 | $12,670 | $483,400 | $113,400 | $370,000 |
| 2018 | $11,081 | $398,900 | $95,100 | $303,800 |
| 2017 | $10,800 | $388,900 | $95,100 | $293,800 |
| 2016 | $10,224 | $388,900 | $95,100 | $293,800 |
| 2015 | $10,086 | $353,400 | $95,100 | $258,300 |
| 2014 | $10,429 | $353,400 | $95,100 | $258,300 |
| 2011 | -- | $86,200 | $86,200 | $0 |
Source: Public Records
Map
Nearby Homes
- 7 Morgan Dr
- 62 Pine St
- 42 Westover Ln
- 36 Westover Ln Unit k
- 49 Robinson Rd
- 15 S Bow Dunbarton Rd
- 13 S Bow Dunbarton Rd
- Lot 41-B Quimby Rd
- 15 Main St
- 7 Ferry St
- 4 Rodger Rd
- 1821 Hooksett Rd
- 121 Hackett Hill Rd
- 100 Main St Unit M10
- 100 Main St Unit 204
- 2 Memory Ln
- 12-14 Church St Unit 12,14
- 422 Dawn Dr Unit 23
- 427 Dawn Dr Unit 15
- 111 Glass St