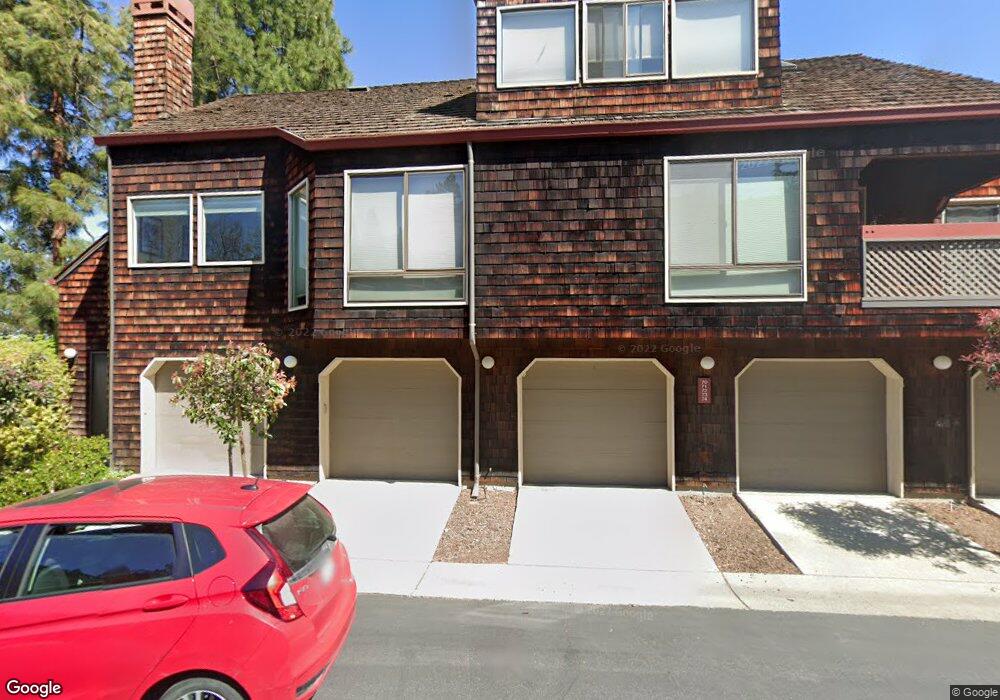
66 Peter Coutts Cir Stanford, CA 94305
Estimated Value: $794,000 - $1,164,227
3
Beds
3
Baths
1,753
Sq Ft
$585/Sq Ft
Est. Value
About This Home
This home is located at 66 Peter Coutts Cir, Stanford, CA 94305 and is currently estimated at $1,026,307, approximately $585 per square foot. 66 Peter Coutts Cir is a home located in Santa Clara County with nearby schools including Lucille M. Nixon Elementary School, Ellen Fletcher Middle, and Henry M. Gunn High School.
Ownership History
Date
Name
Owned For
Owner Type
Purchase Details
Closed on
May 11, 2009
Sold by
Gigante Denise and Rovee Christopher Kent
Bought by
Gigante Denise
Current Estimated Value
Home Financials for this Owner
Home Financials are based on the most recent Mortgage that was taken out on this home.
Original Mortgage
$100,000
Interest Rate
4.71%
Mortgage Type
Negative Amortization
Purchase Details
Closed on
Apr 14, 2000
Sold by
Ferrell James E
Bought by
Ferrell James E and Erickson Britta L
Home Financials for this Owner
Home Financials are based on the most recent Mortgage that was taken out on this home.
Original Mortgage
$205,000
Interest Rate
8%
Mortgage Type
Stand Alone Second
Create a Home Valuation Report for This Property
The Home Valuation Report is an in-depth analysis detailing your home's value as well as a comparison with similar homes in the area
Home Values in the Area
Average Home Value in this Area
Purchase History
| Date | Buyer | Sale Price | Title Company |
|---|---|---|---|
| Gigante Denise | -- | None Available | |
| Ferrell James E | -- | First American Title |
Source: Public Records
Mortgage History
| Date | Status | Borrower | Loan Amount |
|---|---|---|---|
| Closed | Gigante Denise | $100,000 | |
| Closed | Ferrell James E | $205,000 |
Source: Public Records
Tax History
| Year | Tax Paid | Tax Assessment Tax Assessment Total Assessment is a certain percentage of the fair market value that is determined by local assessors to be the total taxable value of land and additions on the property. | Land | Improvement |
|---|---|---|---|---|
| 2025 | $11,611 | $932,156 | $466,078 | $466,078 |
| 2024 | $11,611 | $913,880 | $456,940 | $456,940 |
| 2023 | $11,433 | $895,962 | $447,981 | $447,981 |
| 2022 | $11,294 | $878,396 | $439,198 | $439,198 |
| 2021 | $11,062 | $861,174 | $430,587 | $430,587 |
| 2020 | $10,842 | $852,344 | $426,172 | $426,172 |
| 2019 | $10,709 | $835,632 | $417,816 | $417,816 |
| 2018 | $10,425 | $819,248 | $409,624 | $409,624 |
| 2017 | $10,235 | $803,186 | $401,593 | $401,593 |
| 2016 | $9,953 | $787,438 | $393,719 | $393,719 |
| 2015 | $9,837 | $775,610 | $387,805 | $387,805 |
| 2014 | $9,565 | $760,418 | $380,209 | $380,209 |
Source: Public Records
Map
Nearby Homes
- 103 Peter Coutts Cir
- 823 Sonoma Terrace
- 870 College Ave
- 2050 Williams St
- 410 Sheridan Ave Unit 446
- 102 Koa Ct
- 422 Acacia Ave Unit 14
- 422 Acacia Ave
- 745 Barron Ave
- 101 Acacia Ave
- 200 Sheridan Ave Unit 305
- 200 Sheridan Ave Unit 208
- 200 Sheridan Ave Unit 104
- 200 Sheridan Ave Unit 408
- 200 Sheridan Ave Unit 206
- 200 Sheridan Ave Unit 201
- 200 Sheridan Ave Unit 407
- 763 La Para Ave
- 153 S California Ave Unit F107
- 258 Ventura Ave
- 68 Peter Coutts Cir
- 74 Peter Coutts Cir
- 73 Peter Coutts Cir
- 70 Peter Coutts Cir
- 69 Peter Coutts Cir
- 67 Peter Coutts Cir
- 71 Peter Coutts Cir
- 64 Peter Coutts Cir
- 61 Peter Coutts Cir
- 60 Peter Coutts Cir
- 59 Peter Coutts Cir
- 57 Peter Coutts Cir
- 56 Peter Coutts Cir
- 55 Peter Coutts Cir
- 96 Peter Coutts Cir
- 95 Peter Coutts Cir
- 93 Peter Coutts Cir
- 92 Peter Coutts Cir
- 90 Peter Coutts Cir
- 86 Peter Coutts Cir
Your Personal Tour Guide
Ask me questions while you tour the home.