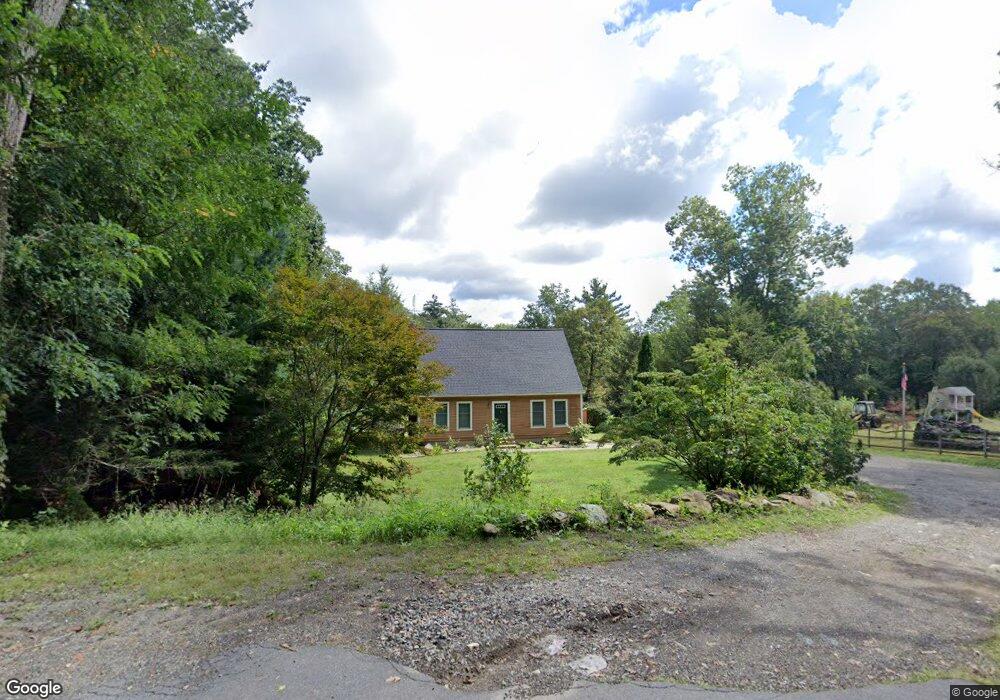
66 Peterson Rd Palmer, MA 01069
Estimated Value: $354,000 - $499,000
3
Beds
4
Baths
1,512
Sq Ft
$284/Sq Ft
Est. Value
About This Home
This home is located at 66 Peterson Rd, Palmer, MA 01069 and is currently estimated at $428,947, approximately $283 per square foot. 66 Peterson Rd is a home located in Hampden County with nearby schools including Old Mill Pond Elementary School, Converse Middle School, and Palmer High School.
Ownership History
Date
Name
Owned For
Owner Type
Purchase Details
Closed on
Mar 24, 2023
Sold by
Bramucci Jane L
Bought by
Sullivan Brian G
Current Estimated Value
Home Financials for this Owner
Home Financials are based on the most recent Mortgage that was taken out on this home.
Original Mortgage
$263,720
Outstanding Balance
$255,426
Interest Rate
6.12%
Mortgage Type
Purchase Money Mortgage
Estimated Equity
$173,521
Purchase Details
Closed on
Dec 26, 2007
Sold by
Piazza Kenneth J and Bramucci Jane L
Bought by
Bramucci Jane L
Home Financials for this Owner
Home Financials are based on the most recent Mortgage that was taken out on this home.
Original Mortgage
$210,000
Interest Rate
6.27%
Mortgage Type
Purchase Money Mortgage
Purchase Details
Closed on
Dec 13, 1993
Sold by
Decker Henry A and Decker Cheryl A
Bought by
Piazza Kenneth J and Piazza Jane L
Purchase Details
Closed on
Nov 20, 1992
Sold by
Christiansen Gordon H
Bought by
Decker Henry A and Decker Cheryl A
Create a Home Valuation Report for This Property
The Home Valuation Report is an in-depth analysis detailing your home's value as well as a comparison with similar homes in the area
Home Values in the Area
Average Home Value in this Area
Purchase History
| Date | Buyer | Sale Price | Title Company |
|---|---|---|---|
| Sullivan Brian G | $260,000 | None Available | |
| Bramucci Jane L | -- | -- | |
| Piazza Kenneth J | $120,000 | -- | |
| Decker Henry A | $32,500 | -- |
Source: Public Records
Mortgage History
| Date | Status | Borrower | Loan Amount |
|---|---|---|---|
| Open | Sullivan Brian G | $263,720 | |
| Previous Owner | Bramucci Jane L | $210,000 | |
| Previous Owner | Decker Henry A | $46,000 | |
| Previous Owner | Decker Henry A | $25,000 | |
| Previous Owner | Decker Henry A | $113,900 |
Source: Public Records
Tax History Compared to Growth
Tax History
| Year | Tax Paid | Tax Assessment Tax Assessment Total Assessment is a certain percentage of the fair market value that is determined by local assessors to be the total taxable value of land and additions on the property. | Land | Improvement |
|---|---|---|---|---|
| 2025 | $7,412 | $408,400 | $76,300 | $332,100 |
| 2024 | $6,942 | $371,800 | $70,200 | $301,600 |
| 2023 | $6,849 | $352,300 | $70,200 | $282,100 |
| 2022 | $6,518 | $304,600 | $61,800 | $242,800 |
| 2021 | $4,531 | $270,100 | $67,900 | $202,200 |
| 2020 | $5,901 | $258,800 | $67,900 | $190,900 |
| 2019 | $5,730 | $258,800 | $67,900 | $190,900 |
| 2018 | $5,558 | $251,700 | $66,200 | $185,500 |
| 2017 | $5,429 | $251,700 | $66,200 | $185,500 |
| 2016 | $5,298 | $249,100 | $64,500 | $184,600 |
| 2015 | $5,124 | $248,400 | $64,500 | $183,900 |
Source: Public Records
Map
Nearby Homes
- 60 Beech St
- 302 Boston Rd
- 0 Old Warren Rd
- 10, 11-12 Ware St
- 0 Flynt St
- 4560 High St
- 135 Thompson St
- Lot 8 Breckenridge St
- 4329 High St
- 275 State St
- Lot 2 State St
- Lot 3 Washington Rd
- 207 Breckenridge St
- 748 River St Unit 1
- L 65-35-1 Pine Hill Dr
- 160 Breckenridge St
- 0 St Unit 73414881
- 98 Mason St
- 52 Washington Rd
- Lots 39-42 Lawrence
- 60 Peterson Rd
- 72 Peterson Rd
- 18 Peterson Rd
- 78 Peterson Rd
- 16 Peterson Rd
- 13 Peterson Rd
- 49 Peterson Rd
- 84 Peterson Rd
- 14 Peterson Rd
- 90 Peterson Rd
- 11 Peterson Rd
- 89 Peterson Rd
- 79 Peterson Rd
- 12 Peterson Rd
- 96 Peterson Rd
- 99 Peterson Rd
- 102 Peterson Rd
- 9 Peterson Rd
- 109 Peterson Rd
- 108 Peterson Rd