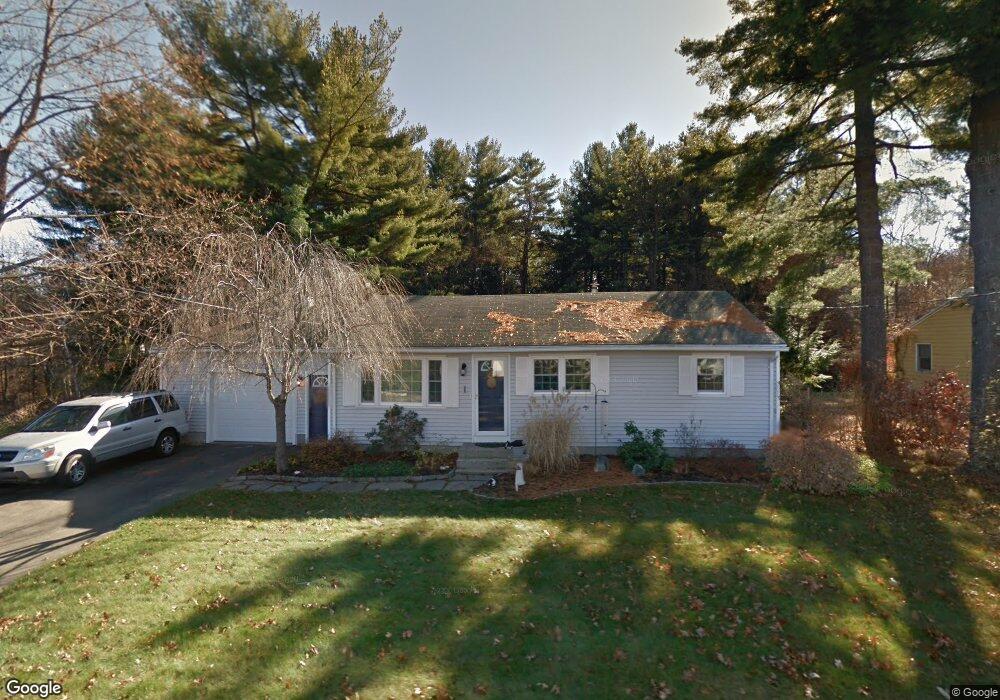
66 Plain St Easthampton, MA 01027
Estimated Value: $412,000 - $429,476
3
Beds
3
Baths
1,376
Sq Ft
$306/Sq Ft
Est. Value
About This Home
This home is located at 66 Plain St, Easthampton, MA 01027 and is currently estimated at $421,369, approximately $306 per square foot. 66 Plain St is a home located in Hampshire County with nearby schools including Easthampton High School, Calvary Baptist Christian School, and Tri-County Schools.
Ownership History
Date
Name
Owned For
Owner Type
Purchase Details
Closed on
Aug 16, 2004
Sold by
Newton James E
Bought by
Newton James E and Newton Josephine C
Current Estimated Value
Create a Home Valuation Report for This Property
The Home Valuation Report is an in-depth analysis detailing your home's value as well as a comparison with similar homes in the area
Home Values in the Area
Average Home Value in this Area
Purchase History
| Date | Buyer | Sale Price | Title Company |
|---|---|---|---|
| Newton James E | -- | -- |
Source: Public Records
Mortgage History
| Date | Status | Borrower | Loan Amount |
|---|---|---|---|
| Open | Newton James E | $208,000 |
Source: Public Records
Tax History
| Year | Tax Paid | Tax Assessment Tax Assessment Total Assessment is a certain percentage of the fair market value that is determined by local assessors to be the total taxable value of land and additions on the property. | Land | Improvement |
|---|---|---|---|---|
| 2025 | $4,884 | $357,300 | $112,500 | $244,800 |
| 2024 | $4,716 | $347,800 | $109,100 | $238,700 |
| 2023 | $3,586 | $244,800 | $86,200 | $158,600 |
| 2022 | $4,047 | $244,800 | $86,200 | $158,600 |
| 2021 | $4,429 | $252,500 | $86,200 | $166,300 |
| 2020 | $4,348 | $244,800 | $86,200 | $158,600 |
| 2019 | $3,642 | $235,600 | $86,200 | $149,400 |
| 2018 | $3,498 | $218,600 | $81,500 | $137,100 |
| 2017 | $3,415 | $210,700 | $78,300 | $132,400 |
| 2016 | $3,548 | $227,600 | $78,300 | $149,300 |
| 2015 | $3,448 | $227,600 | $78,300 | $149,300 |
Source: Public Records
Map
Nearby Homes
Your Personal Tour Guide
Ask me questions while you tour the home.