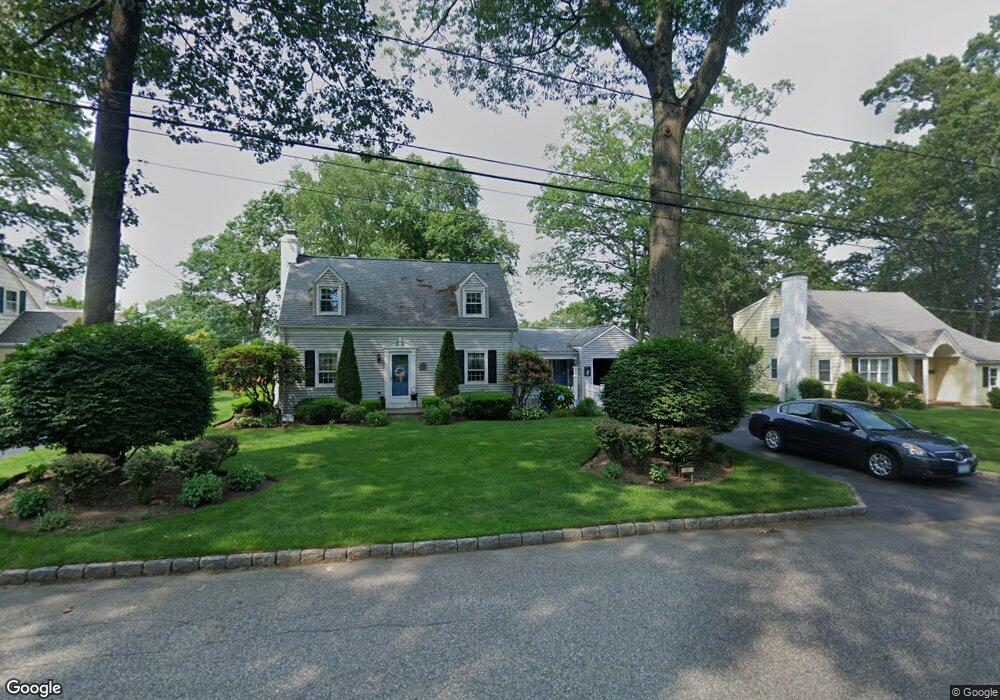
66 Sagamore Rd Cranston, RI 02920
Meshanticut NeighborhoodEstimated Value: $450,000 - $558,000
3
Beds
2
Baths
1,611
Sq Ft
$319/Sq Ft
Est. Value
About This Home
This home is located at 66 Sagamore Rd, Cranston, RI 02920 and is currently estimated at $513,828, approximately $318 per square foot. 66 Sagamore Rd is a home located in Providence County with nearby schools including Woodridge Elementary School, Western Hills Middle School, and Cranston High School West.
Ownership History
Date
Name
Owned For
Owner Type
Purchase Details
Closed on
May 19, 2020
Sold by
Bliss Carol C
Bought by
Bliss Allan D and Bliss Carol C
Current Estimated Value
Purchase Details
Closed on
Feb 11, 2013
Sold by
Bliss Allan D and Bliss Carol C
Bought by
Bliss Allan D and Bliss Carol C
Create a Home Valuation Report for This Property
The Home Valuation Report is an in-depth analysis detailing your home's value as well as a comparison with similar homes in the area
Home Values in the Area
Average Home Value in this Area
Purchase History
| Date | Buyer | Sale Price | Title Company |
|---|---|---|---|
| Bliss Allan D | -- | None Available | |
| Bliss Allan D | -- | None Available | |
| Bliss Allan D | -- | -- |
Source: Public Records
Mortgage History
| Date | Status | Borrower | Loan Amount |
|---|---|---|---|
| Previous Owner | Bliss Allan D | $172,000 |
Source: Public Records
Tax History Compared to Growth
Tax History
| Year | Tax Paid | Tax Assessment Tax Assessment Total Assessment is a certain percentage of the fair market value that is determined by local assessors to be the total taxable value of land and additions on the property. | Land | Improvement |
|---|---|---|---|---|
| 2025 | $5,834 | $420,300 | $145,700 | $274,600 |
| 2024 | $5,720 | $420,300 | $145,700 | $274,600 |
| 2023 | $5,804 | $307,100 | $104,200 | $202,900 |
| 2022 | $5,684 | $307,100 | $104,200 | $202,900 |
| 2021 | $5,528 | $307,100 | $104,200 | $202,900 |
| 2020 | $5,465 | $263,100 | $108,000 | $155,100 |
| 2019 | $5,465 | $263,100 | $108,000 | $155,100 |
| 2018 | $5,338 | $263,100 | $108,000 | $155,100 |
| 2017 | $5,290 | $230,600 | $100,500 | $130,100 |
| 2016 | $5,177 | $230,600 | $100,500 | $130,100 |
| 2015 | $5,177 | $230,600 | $100,500 | $130,100 |
| 2014 | $5,105 | $223,500 | $108,000 | $115,500 |
Source: Public Records
Map
Nearby Homes
- 0 Rutland St
- 69 W View Ave
- 210 Hyde St
- 99 Salem Ave
- 141 Glen Ridge Rd
- 446 Budlong Rd
- 46 Lilyana Way
- 21 Charles St
- 10 Sheffield Rd
- 71 Norton Ave
- 111 Belgium St
- 275 Meshanticut Valley Pkwy
- 34 Aldrich Ave
- 80 Phenix Ave
- 1455 Park Ave Unit 3
- 28 Hybrid Dr
- 145 E Hill Dr
- 203 Dean Ridge Ct
- 46 Roslyn Ave
- 51 E Bel Air Rd