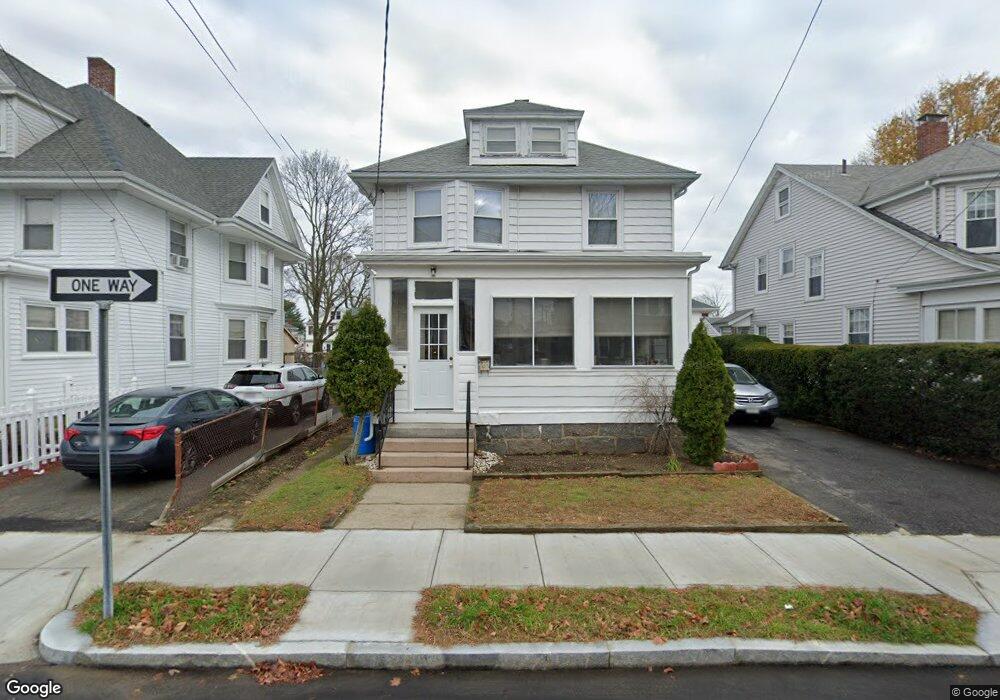
66 Tyler St Quincy, MA 02170
North Quincy NeighborhoodEstimated Value: $717,708 - $875,000
4
Beds
1
Bath
1,581
Sq Ft
$505/Sq Ft
Est. Value
About This Home
This home is located at 66 Tyler St, Quincy, MA 02170 and is currently estimated at $799,177, approximately $505 per square foot. 66 Tyler St is a home located in Norfolk County with nearby schools including Francis W. Parker Elementary School, Atlantic Middle School, and North Quincy High School.
Ownership History
Date
Name
Owned For
Owner Type
Purchase Details
Closed on
Oct 5, 1988
Sold by
Senter Arthur I
Bought by
Chen De G
Current Estimated Value
Home Financials for this Owner
Home Financials are based on the most recent Mortgage that was taken out on this home.
Original Mortgage
$100,000
Interest Rate
10.64%
Mortgage Type
Purchase Money Mortgage
Create a Home Valuation Report for This Property
The Home Valuation Report is an in-depth analysis detailing your home's value as well as a comparison with similar homes in the area
Home Values in the Area
Average Home Value in this Area
Purchase History
| Date | Buyer | Sale Price | Title Company |
|---|---|---|---|
| Chen De G | $170,000 | -- |
Source: Public Records
Mortgage History
| Date | Status | Borrower | Loan Amount |
|---|---|---|---|
| Closed | Chen De G | $50,000 | |
| Closed | Chen De G | $100,000 |
Source: Public Records
Tax History Compared to Growth
Tax History
| Year | Tax Paid | Tax Assessment Tax Assessment Total Assessment is a certain percentage of the fair market value that is determined by local assessors to be the total taxable value of land and additions on the property. | Land | Improvement |
|---|---|---|---|---|
| 2025 | $7,267 | $630,300 | $353,300 | $277,000 |
| 2024 | $6,984 | $619,700 | $353,300 | $266,400 |
| 2023 | $6,435 | $573,400 | $321,200 | $252,200 |
| 2022 | $6,109 | $509,900 | $257,000 | $252,900 |
| 2021 | $5,836 | $480,700 | $257,000 | $223,700 |
| 2020 | $5,755 | $463,000 | $251,900 | $211,100 |
| 2019 | $5,649 | $450,100 | $242,200 | $207,900 |
| 2018 | $5,573 | $417,800 | $230,700 | $187,100 |
| 2017 | $5,427 | $383,000 | $209,700 | $173,300 |
| 2016 | $5,045 | $351,300 | $190,600 | $160,700 |
| 2015 | $4,675 | $320,200 | $173,300 | $146,900 |
| 2014 | $4,523 | $304,400 | $173,300 | $131,100 |
Source: Public Records
Map
Nearby Homes
- 11 Earle St
- 17 Holmes St Unit 2
- 17 Holmes St Unit 4
- 85 E Squantum St Unit 10
- 143 Arlington St
- 58 Bayfield Rd S
- 250 Fayette St
- 140 Phillips St
- 115 W Squantum St Unit 907
- 115 W Squantum St Unit 810
- 297 Billings St
- 201 Billings St
- 22 Conant Rd
- 163 Clay St Unit C
- 91 Atlantic St
- 100 Grandview Ave Unit 11A
- 111 Warren Ave Unit 1F
- 22 Newton Ave
- 100 Thornton St
- 68 Atlantic St