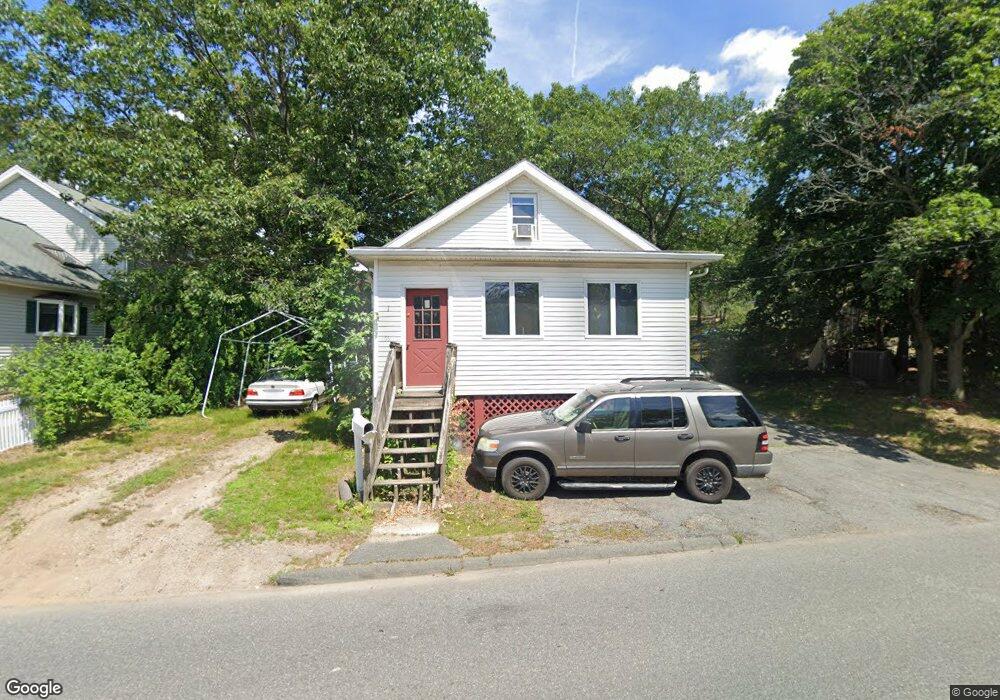
66 Vine St Saugus, MA 01906
Pleasant Hills NeighborhoodEstimated Value: $594,342 - $673,000
2
Beds
1
Bath
1,168
Sq Ft
$542/Sq Ft
Est. Value
About This Home
This home is located at 66 Vine St, Saugus, MA 01906 and is currently estimated at $632,836, approximately $541 per square foot. 66 Vine St is a home located in Essex County with nearby schools including Saugus High School, Pioneer Charter School Of Science II, and Sacred Heart School.
Ownership History
Date
Name
Owned For
Owner Type
Purchase Details
Closed on
Sep 30, 2008
Sold by
Hynes Rt and Hynes Patrick E
Bought by
Hynes Patrick E
Current Estimated Value
Home Financials for this Owner
Home Financials are based on the most recent Mortgage that was taken out on this home.
Original Mortgage
$186,000
Outstanding Balance
$124,514
Interest Rate
6.57%
Mortgage Type
Purchase Money Mortgage
Estimated Equity
$508,322
Create a Home Valuation Report for This Property
The Home Valuation Report is an in-depth analysis detailing your home's value as well as a comparison with similar homes in the area
Home Values in the Area
Average Home Value in this Area
Purchase History
| Date | Buyer | Sale Price | Title Company |
|---|---|---|---|
| Hynes Patrick E | -- | -- |
Source: Public Records
Mortgage History
| Date | Status | Borrower | Loan Amount |
|---|---|---|---|
| Open | Hynes Patrick E | $186,000 | |
| Previous Owner | Hynes Patrick E | $150,000 | |
| Previous Owner | Hynes Patrick E | $110,000 | |
| Previous Owner | Hynes Patrick E | $42,000 |
Source: Public Records
Tax History Compared to Growth
Tax History
| Year | Tax Paid | Tax Assessment Tax Assessment Total Assessment is a certain percentage of the fair market value that is determined by local assessors to be the total taxable value of land and additions on the property. | Land | Improvement |
|---|---|---|---|---|
| 2025 | $5,563 | $520,900 | $332,300 | $188,600 |
| 2024 | $5,193 | $487,600 | $302,200 | $185,400 |
| 2023 | $5,168 | $459,000 | $272,200 | $186,800 |
| 2022 | $5,053 | $420,700 | $249,000 | $171,700 |
| 2021 | $4,713 | $381,900 | $217,000 | $164,900 |
| 2020 | $4,247 | $356,300 | $207,000 | $149,300 |
| 2019 | $3,905 | $320,600 | $187,000 | $133,600 |
| 2018 | $3,578 | $309,000 | $182,000 | $127,000 |
| 2017 | $3,378 | $280,300 | $170,000 | $110,300 |
| 2016 | $3,162 | $259,200 | $161,600 | $97,600 |
| 2015 | $2,969 | $247,000 | $154,000 | $93,000 |
| 2014 | $2,986 | $257,200 | $154,000 | $103,200 |
Source: Public Records
Map
Nearby Homes