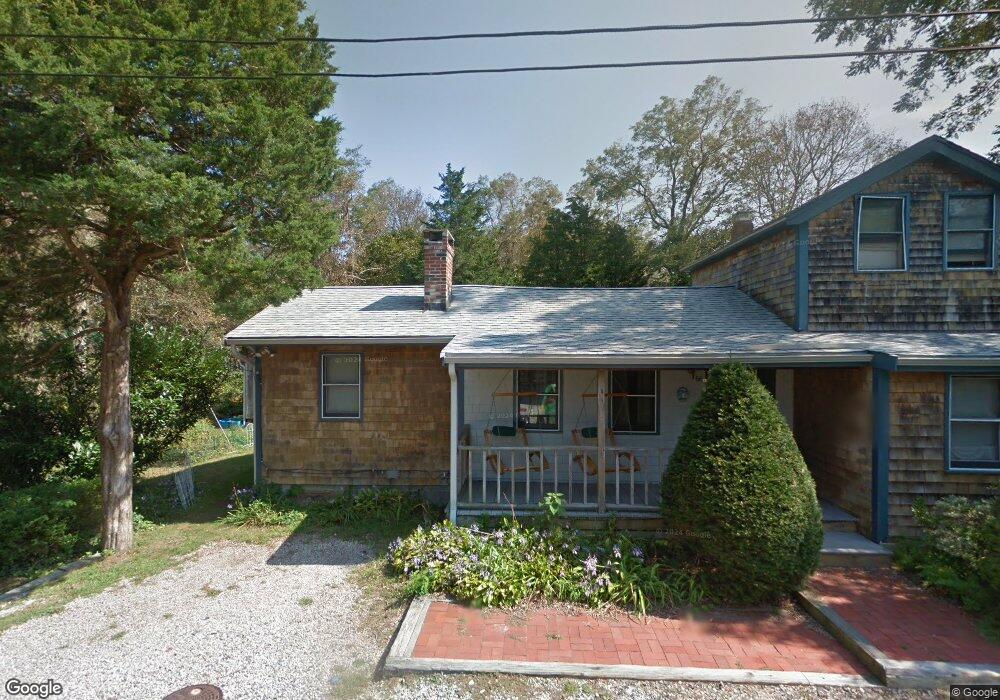
66 Wamsutta Ave Pocasset, MA 02559
Pocasset NeighborhoodEstimated Value: $679,158 - $752,000
2
Beds
1
Bath
943
Sq Ft
$771/Sq Ft
Est. Value
About This Home
This home is located at 66 Wamsutta Ave, Pocasset, MA 02559 and is currently estimated at $727,290, approximately $771 per square foot. 66 Wamsutta Ave is a home located in Barnstable County with nearby schools including Bourne High School, Cadence Academy Preschool - Bourne, and Heritage Christian Academy.
Ownership History
Date
Name
Owned For
Owner Type
Purchase Details
Closed on
Dec 13, 2012
Sold by
Sarah P Lyons Ret and Lyons
Bought by
Lyons 66 Wamsutta Ave and Lyons L
Current Estimated Value
Purchase Details
Closed on
Jun 4, 2004
Sold by
Wieler Maureen T and Wieler William E
Bought by
Sarah P Lyons Ret and Lyons
Purchase Details
Closed on
May 29, 1992
Sold by
Greeley Robert E and Greeley Nancy E
Bought by
Wieler William E
Create a Home Valuation Report for This Property
The Home Valuation Report is an in-depth analysis detailing your home's value as well as a comparison with similar homes in the area
Home Values in the Area
Average Home Value in this Area
Purchase History
| Date | Buyer | Sale Price | Title Company |
|---|---|---|---|
| Lyons 66 Wamsutta Ave | -- | -- | |
| Lyons 66 Wamsutta Ave | -- | -- | |
| Sarah P Lyons Ret | $345,000 | -- | |
| Sarah P Lyons Ret | $345,000 | -- | |
| Wieler William E | $72,000 | -- | |
| Wieler William E | $72,000 | -- |
Source: Public Records
Mortgage History
| Date | Status | Borrower | Loan Amount |
|---|---|---|---|
| Previous Owner | Wieler William E | $70,000 | |
| Previous Owner | Wieler William E | $65,000 | |
| Previous Owner | Wieler William E | $10,000 |
Source: Public Records
Tax History Compared to Growth
Tax History
| Year | Tax Paid | Tax Assessment Tax Assessment Total Assessment is a certain percentage of the fair market value that is determined by local assessors to be the total taxable value of land and additions on the property. | Land | Improvement |
|---|---|---|---|---|
| 2025 | $4,423 | $566,300 | $381,000 | $185,300 |
| 2024 | $4,324 | $539,200 | $362,800 | $176,400 |
| 2023 | $4,207 | $477,500 | $321,100 | $156,400 |
| 2022 | $3,799 | $376,500 | $251,900 | $124,600 |
| 2021 | $3,693 | $342,900 | $229,200 | $113,700 |
| 2020 | $3,596 | $334,800 | $227,000 | $107,800 |
| 2019 | $3,457 | $328,900 | $227,000 | $101,900 |
| 2018 | $3,313 | $314,300 | $221,800 | $92,500 |
| 2017 | $3,205 | $311,200 | $219,700 | $91,500 |
| 2016 | $2,840 | $279,500 | $208,700 | $70,800 |
| 2015 | $2,649 | $263,100 | $192,300 | $70,800 |
Source: Public Records
Map
Nearby Homes
- 171 Bellavista Dr
- 254 Barlows Landing Rd
- 34 Kenwood Rd
- 22 Nairn Rd
- 45 Kenwood Rd
- 70 Wings Neck Rd
- 940 County Rd
- 709 County Rd
- 24 Richmond Rd
- 14 Navajo Rd
- 48 Red Brook Harbor Rd
- 3 Red Brook Pond Dr
- 174 Barlows Landing Rd
- 940 County Rd
- 1094 County Rd
- 7 4th Ave
- 15 1st St
- 39 Bennets Neck Dr
- 89 Harbor Dr
- 7 Portside Dr