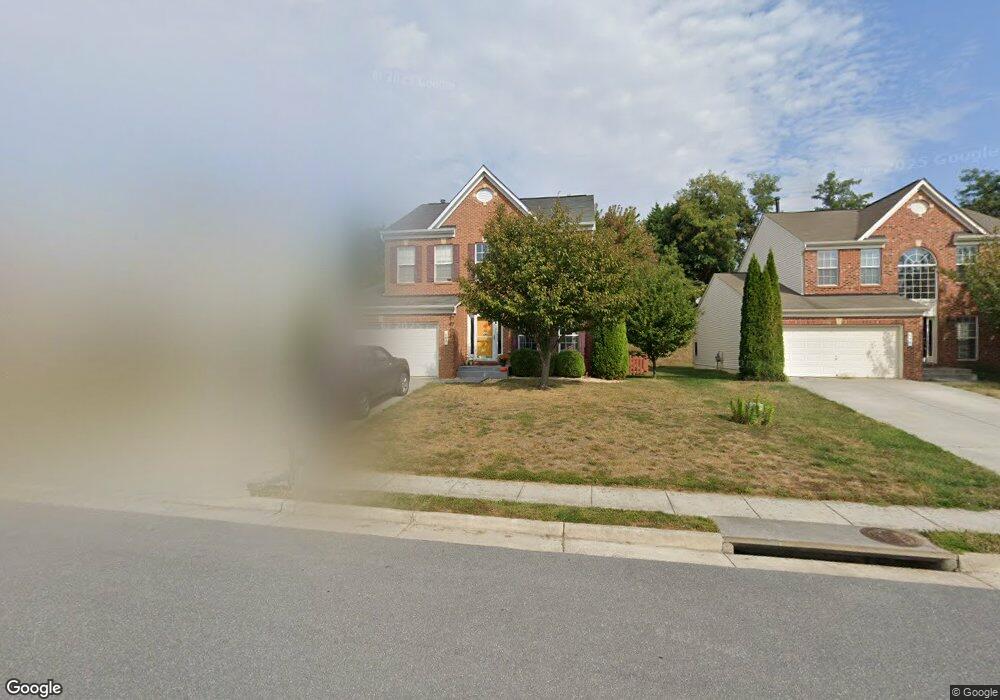
660 Beehive Way Winchester, VA 22601
Estimated Value: $499,000 - $547,000
4
Beds
4
Baths
2,450
Sq Ft
$214/Sq Ft
Est. Value
About This Home
This home is located at 660 Beehive Way, Winchester, VA 22601 and is currently estimated at $523,479, approximately $213 per square foot. 660 Beehive Way is a home located in Winchester City with nearby schools including Garland R. Quarles Elementary School, Daniel Morgan Middle School, and John Handley High School.
Ownership History
Date
Name
Owned For
Owner Type
Purchase Details
Closed on
May 11, 2018
Sold by
Wilt Lisa M and Swick Joyce
Bought by
Ball Zachary A and Ball Kimberly A
Current Estimated Value
Home Financials for this Owner
Home Financials are based on the most recent Mortgage that was taken out on this home.
Original Mortgage
$334,030
Outstanding Balance
$287,876
Interest Rate
4.44%
Mortgage Type
VA
Estimated Equity
$235,603
Purchase Details
Closed on
May 24, 2011
Sold by
Moscheto Paul F and Wilt Lisa M
Bought by
Wolt Lisa L and Swick Joyce
Home Financials for this Owner
Home Financials are based on the most recent Mortgage that was taken out on this home.
Original Mortgage
$286,309
Interest Rate
5.5%
Mortgage Type
FHA
Purchase Details
Closed on
Jul 10, 2008
Sold by
Richmond America Homes Inc
Bought by
Moschetto Paul F and Wilt Lisa M
Home Financials for this Owner
Home Financials are based on the most recent Mortgage that was taken out on this home.
Original Mortgage
$282,765
Interest Rate
6.17%
Mortgage Type
FHA
Create a Home Valuation Report for This Property
The Home Valuation Report is an in-depth analysis detailing your home's value as well as a comparison with similar homes in the area
Home Values in the Area
Average Home Value in this Area
Purchase History
| Date | Buyer | Sale Price | Title Company |
|---|---|---|---|
| Ball Zachary A | $327,000 | Commonwealth Land Title Inur | |
| Wolt Lisa L | -- | None Available | |
| Moschetto Paul F | $285,000 | None Available | |
| Moschetto Paul F | $285,000 | None Available |
Source: Public Records
Mortgage History
| Date | Status | Borrower | Loan Amount |
|---|---|---|---|
| Open | Ball Zachary A | $334,030 | |
| Previous Owner | Wolt Lisa L | $286,309 | |
| Previous Owner | Moschetto Paul F | $282,765 |
Source: Public Records
Tax History Compared to Growth
Tax History
| Year | Tax Paid | Tax Assessment Tax Assessment Total Assessment is a certain percentage of the fair market value that is determined by local assessors to be the total taxable value of land and additions on the property. | Land | Improvement |
|---|---|---|---|---|
| 2025 | $3,737 | $470,000 | $70,000 | $400,000 |
| 2024 | $3,432 | $413,500 | $70,000 | $343,500 |
| 2023 | $3,432 | $413,500 | $70,000 | $343,500 |
| 2022 | $2,876 | $309,200 | $70,000 | $239,200 |
| 2021 | $2,876 | $309,200 | $70,000 | $239,200 |
| 2020 | $2,783 | $299,300 | $70,000 | $229,300 |
| 2019 | $2,783 | $299,300 | $70,000 | $229,300 |
| 2018 | $2,633 | $289,300 | $70,000 | $219,300 |
| 2017 | $2,633 | $289,300 | $70,000 | $219,300 |
| 2016 | $2,361 | $259,500 | $70,000 | $189,500 |
| 2015 | $2,361 | $259,500 | $70,000 | $189,500 |
| 2014 | $2,219 | $233,600 | $70,000 | $163,600 |
Source: Public Records
Map
Nearby Homes
- 930 Wayne Dr
- 1829 Harvest Dr
- 1805 Harvest Dr
- 1817 Harvest Dr
- 681 Hillman Dr
- Adams Plan at Abrams Crossing at Meadow Branch
- Adams II Plan at Abrams Crossing at Meadow Branch
- 2165 Harvest Dr
- 908 Cedar Creek Grade
- 1815 Reese
- TBB Monteith Dr Unit DEEP CREEK II
- TBB Monteith Dr Unit BEDFORD II
- 553 Bellview Ave
- TBD Scented Rose Way
- 114 Scented Rose Way
- CLIFTON Plan at Willow Run
- BRISTOL Plan at Willow Run
- FREEPORT DUPLEX Plan at Willow Run
- DOVER Plan at Willow Run
- AZALEA Plan at Willow Run
- 670 Beehive Way
- 650 Beehive Way
- 680 Beehive Way
- 640 Beehive Way
- 600 Sterling Dr
- 705 Chelsea Dr
- 690 Beehive Way
- 665 Beehive Way
- 630 Beehive Way
- 709 Chelsea Dr
- 675 Beehive Way
- 700 Beehive Way
- 602 Sterling Dr
- 460 Wharton Cir
- 620 Beehive Way
- 685 Beehive Way
- 440 Wharton Cir
- 655 Beehive Way
- 625 Beehive Way
- 710 Beehive Way