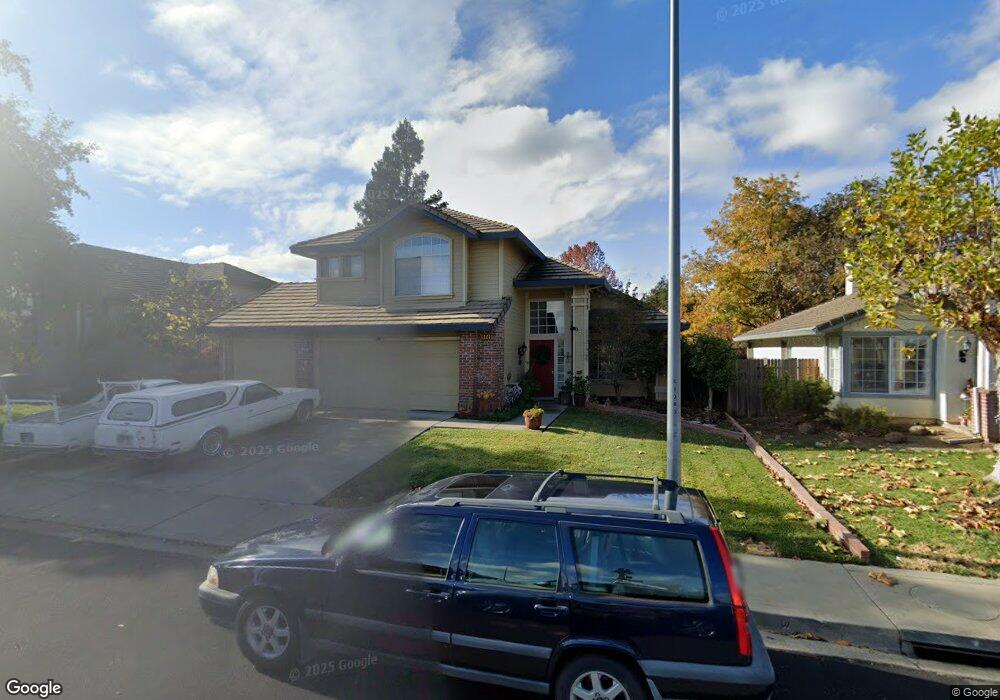
660 Harvard Ave Vacaville, CA 95687
Estimated Value: $690,732 - $735,000
5
Beds
3
Baths
2,266
Sq Ft
$313/Sq Ft
Est. Value
About This Home
This home is located at 660 Harvard Ave, Vacaville, CA 95687 and is currently estimated at $708,933, approximately $312 per square foot. 660 Harvard Ave is a home located in Solano County with nearby schools including Cooper Elementary School, Orchard Elementary School, and Vaca Pena Middle School.
Ownership History
Date
Name
Owned For
Owner Type
Purchase Details
Closed on
Aug 30, 2021
Sold by
Mcdermott Joseph and Mcdermott Kathleen
Bought by
Mcdermott Kathleen and Mcdermott Joseph
Current Estimated Value
Home Financials for this Owner
Home Financials are based on the most recent Mortgage that was taken out on this home.
Original Mortgage
$250,000
Outstanding Balance
$227,142
Interest Rate
2.7%
Mortgage Type
New Conventional
Estimated Equity
$481,791
Purchase Details
Closed on
Sep 21, 2016
Sold by
Mcdermott Joseph B and Mcdermott Kathleen S
Bought by
Mcdermott Kathleen and Mcdermott Joseph
Purchase Details
Closed on
Feb 17, 2011
Sold by
Moore Martin W and Moore Debra K
Bought by
Mcdermott Joseph B and Mcdermott Kathleen S
Home Financials for this Owner
Home Financials are based on the most recent Mortgage that was taken out on this home.
Original Mortgage
$204,000
Interest Rate
4.67%
Mortgage Type
New Conventional
Create a Home Valuation Report for This Property
The Home Valuation Report is an in-depth analysis detailing your home's value as well as a comparison with similar homes in the area
Home Values in the Area
Average Home Value in this Area
Purchase History
| Date | Buyer | Sale Price | Title Company |
|---|---|---|---|
| Mcdermott Kathleen | -- | Consumers Title Co Of Ca | |
| Mcdermott Joseph | -- | Consumers Title Co Of Ca | |
| Mcdermott Kathleen | -- | None Available | |
| Mcdermott Joseph B | $279,000 | Old Republic Title Company |
Source: Public Records
Mortgage History
| Date | Status | Borrower | Loan Amount |
|---|---|---|---|
| Open | Mcdermott Joseph | $250,000 | |
| Closed | Mcdermott Joseph B | $204,000 |
Source: Public Records
Tax History Compared to Growth
Tax History
| Year | Tax Paid | Tax Assessment Tax Assessment Total Assessment is a certain percentage of the fair market value that is determined by local assessors to be the total taxable value of land and additions on the property. | Land | Improvement |
|---|---|---|---|---|
| 2025 | $4,236 | $357,438 | $115,301 | $242,137 |
| 2024 | $4,236 | $350,431 | $113,041 | $237,390 |
| 2023 | $4,125 | $343,561 | $110,825 | $232,736 |
| 2022 | $4,034 | $336,825 | $108,653 | $228,172 |
| 2021 | $4,037 | $330,222 | $106,523 | $223,699 |
| 2020 | $3,983 | $326,837 | $105,431 | $221,406 |
| 2019 | $3,914 | $320,429 | $103,364 | $217,065 |
| 2018 | $3,858 | $314,147 | $101,338 | $212,809 |
| 2017 | $3,724 | $307,988 | $99,351 | $208,637 |
| 2016 | $3,701 | $301,950 | $97,403 | $204,547 |
| 2015 | $3,652 | $297,415 | $95,940 | $201,475 |
| 2014 | $3,429 | $291,590 | $94,061 | $197,529 |
Source: Public Records
Map
Nearby Homes
- 725 Wellsey Rd
- 654 Rutgers St
- 1055 Notre Dame Cir
- 309 Regency Cir
- 313 Toyon Ln
- 725 Arabian Cir
- 431 Stanford St
- 142 Nantucket Cir
- 420 Temple Dr
- 755 Oak Hollow Ave
- 137 Edwin Dr
- 154 Edwin Dr
- 113 Asbury Dr
- 512 Oakmeadow Ct
- 412 Marvin Gardens Dr
- 524 Arcadia Dr
- 124 Dover Way
- 418 Gatehouse Dr
- 350 Saybrook Ct
- 190 Huntington Dr