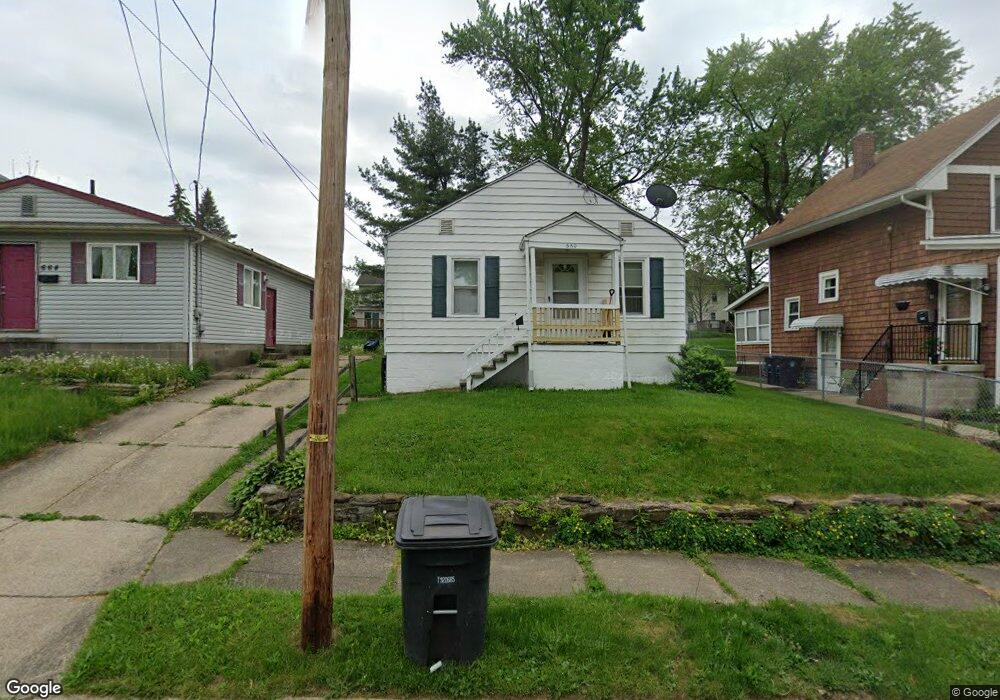
660 Hollibaugh Ave Akron, OH 44310
North Hill NeighborhoodEstimated Value: $71,000 - $121,000
2
Beds
1
Bath
672
Sq Ft
$131/Sq Ft
Est. Value
About This Home
This home is located at 660 Hollibaugh Ave, Akron, OH 44310 and is currently estimated at $88,282, approximately $131 per square foot. 660 Hollibaugh Ave is a home located in Summit County with nearby schools including North High School, Edge Academy, The, and Steel Academy.
Ownership History
Date
Name
Owned For
Owner Type
Purchase Details
Closed on
Aug 13, 2010
Sold by
Stanley Arthur Leroy and Stanley Pamela Jane
Bought by
Stanley Arthur L and Stanley Pamela J
Current Estimated Value
Create a Home Valuation Report for This Property
The Home Valuation Report is an in-depth analysis detailing your home's value as well as a comparison with similar homes in the area
Home Values in the Area
Average Home Value in this Area
Purchase History
| Date | Buyer | Sale Price | Title Company |
|---|---|---|---|
| Stanley Arthur L | -- | Attorney |
Source: Public Records
Tax History Compared to Growth
Tax History
| Year | Tax Paid | Tax Assessment Tax Assessment Total Assessment is a certain percentage of the fair market value that is determined by local assessors to be the total taxable value of land and additions on the property. | Land | Improvement |
|---|---|---|---|---|
| 2025 | $1,154 | $20,510 | $5,600 | $14,910 |
| 2024 | $1,154 | $20,510 | $5,600 | $14,910 |
| 2023 | $1,154 | $20,510 | $5,600 | $14,910 |
| 2022 | $1,131 | $15,779 | $4,309 | $11,470 |
| 2021 | $1,132 | $15,779 | $4,309 | $11,470 |
| 2020 | $1,116 | $15,780 | $4,310 | $11,470 |
| 2019 | $1,145 | $14,740 | $4,650 | $10,090 |
| 2018 | $1,130 | $14,740 | $4,650 | $10,090 |
| 2017 | $1,085 | $14,740 | $4,650 | $10,090 |
| 2016 | $1,085 | $13,870 | $4,650 | $9,220 |
| 2015 | $1,085 | $13,870 | $4,650 | $9,220 |
| 2014 | $1,076 | $13,870 | $4,650 | $9,220 |
| 2013 | $1,146 | $15,160 | $4,650 | $10,510 |
Source: Public Records
Map
Nearby Homes
- 630 Ranney St
- 523 Evans Ave
- 553 Fouse Ave
- 899 Davis St
- 855 Dan St
- 868 Iredell St
- 614 Parkview Ave
- 914 Dan St
- 991 Nevin St
- 389 E Glenwood Ave
- 335 Zeller Ave
- 354 Zeller Ave
- 472 E Tallmadge Ave
- 551 Oxford Ave
- 559 Patterson Ave
- 495 Delmar Ave
- 370 E Tallmadge Ave
- 354 Julien Ave
- 336 N Adams St
- 233 Arch St
- 656 Hollibaugh Ave
- 664 Hollibaugh Ave
- 652 Hollibaugh Ave
- 670 Hollibaugh Ave
- 657 Villa Ave
- 665 Villa Ave
- 648 Hollibaugh Ave
- 653 Villa Ave
- 661 Hollibaugh Ave
- 663 Hollibaugh Ave
- 667 Hollibaugh Ave
- 678 Hollibaugh Ave
- 642 Hollibaugh Ave
- 647 Hollibaugh Ave
- 677 Villa Ave
- 643 Hollibaugh Ave
- 681 Villa Ave
- 636 Hollibaugh Ave
- 682 Hollibaugh Ave
- 639 Hollibaugh Ave