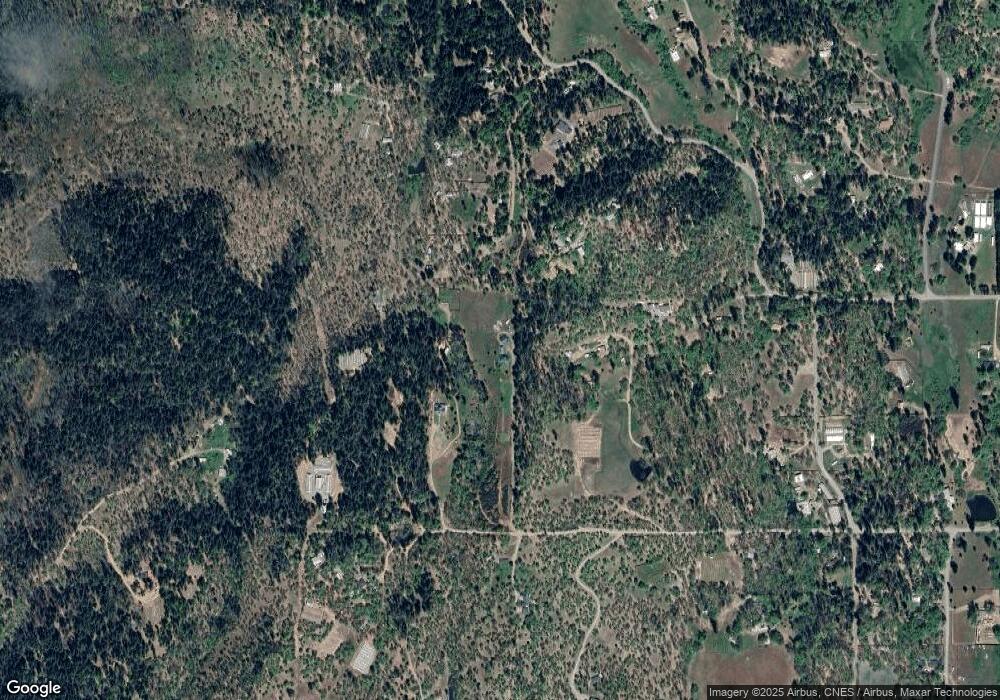
660 Kellogg Gulch Rd Hayfork, CA 96041
Estimated Value: $367,000 - $475,483
2
Beds
3
Baths
1,897
Sq Ft
$219/Sq Ft
Est. Value
About This Home
This home is located at 660 Kellogg Gulch Rd, Hayfork, CA 96041 and is currently estimated at $414,828, approximately $218 per square foot. 660 Kellogg Gulch Rd is a home with nearby schools including Hayfork High School.
Ownership History
Date
Name
Owned For
Owner Type
Purchase Details
Closed on
Jul 18, 2013
Sold by
Simmons Frederick C
Bought by
Simmons Frederick C
Current Estimated Value
Purchase Details
Closed on
Aug 11, 2005
Sold by
Mccollum James Keith
Bought by
Simmons Frederick C
Purchase Details
Closed on
Jul 12, 2005
Sold by
Bartels Nichole and Bartels Jake
Bought by
Mccollum James Keith
Create a Home Valuation Report for This Property
The Home Valuation Report is an in-depth analysis detailing your home's value as well as a comparison with similar homes in the area
Home Values in the Area
Average Home Value in this Area
Purchase History
| Date | Buyer | Sale Price | Title Company |
|---|---|---|---|
| Simmons Frederick C | -- | None Available | |
| Simmons Frederick C | $95,000 | Trinity Co Title Co | |
| Mccollum James Keith | -- | Trinity Co Title Co | |
| Mccollum James Keith | -- | -- |
Source: Public Records
Tax History
| Year | Tax Paid | Tax Assessment Tax Assessment Total Assessment is a certain percentage of the fair market value that is determined by local assessors to be the total taxable value of land and additions on the property. | Land | Improvement |
|---|---|---|---|---|
| 2025 | $5,098 | $465,848 | $133,712 | $332,136 |
| 2024 | $5,017 | $456,715 | $131,091 | $325,624 |
| 2023 | $5,017 | $447,761 | $128,521 | $319,240 |
| 2022 | $4,914 | $438,982 | $126,001 | $312,981 |
| 2021 | $4,527 | $430,376 | $123,531 | $306,845 |
| 2020 | $4,471 | $425,964 | $122,265 | $303,699 |
| 2019 | $4,385 | $417,613 | $119,868 | $297,745 |
| 2018 | $4,244 | $409,425 | $117,518 | $291,907 |
| 2017 | $4,231 | $401,398 | $115,214 | $286,184 |
| 2016 | $4,068 | $393,528 | $112,955 | $280,573 |
| 2015 | $4,006 | $387,618 | $111,259 | $276,359 |
| 2014 | $3,951 | $380,026 | $109,080 | $270,946 |
Source: Public Records
Map
Nearby Homes
