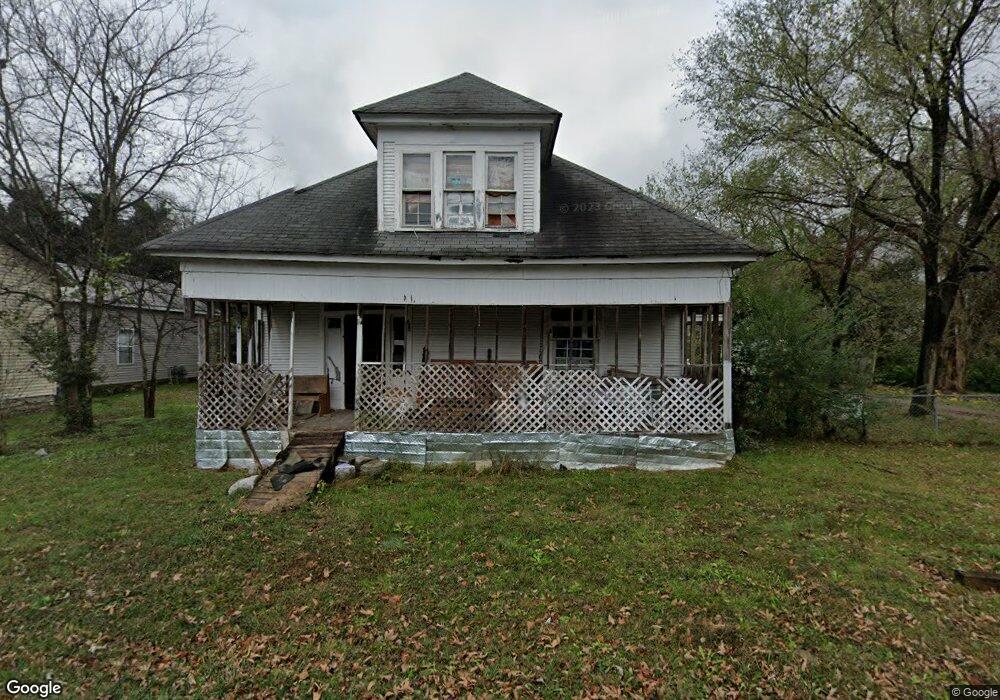
660 Limestone Ave Lewisburg, TN 37091
Estimated Value: $117,196 - $220,000
--
Bed
1
Bath
1,380
Sq Ft
$136/Sq Ft
Est. Value
About This Home
This home is located at 660 Limestone Ave, Lewisburg, TN 37091 and is currently estimated at $187,549, approximately $135 per square foot. 660 Limestone Ave is a home located in Marshall County with nearby schools including Marshall Elementary School, Oak Grove Elementary School, and Westhills Elementary School.
Ownership History
Date
Name
Owned For
Owner Type
Purchase Details
Closed on
Dec 20, 2016
Sold by
Giles Thomas William
Bought by
Provance Pllc
Current Estimated Value
Purchase Details
Closed on
Feb 25, 2014
Sold by
Gregory Barry
Bought by
Giles Thomas
Purchase Details
Closed on
Sep 4, 2009
Sold by
Grieshaber Michael Scott E
Bought by
Gregory Barry
Purchase Details
Closed on
Oct 6, 2005
Sold by
Darrell Mceachron
Bought by
Barry Gregory
Purchase Details
Closed on
Oct 5, 2005
Sold by
Scott Grieshaber Michael
Bought by
Darrell Mceachron
Purchase Details
Closed on
May 28, 1998
Sold by
Jett Frankie L
Bought by
Grieshaber Michael S
Purchase Details
Closed on
Jul 19, 1996
Sold by
Jett Franklin L
Bought by
Jett Frankie L
Purchase Details
Closed on
Jun 12, 1996
Sold by
Jett Frankie L
Bought by
Jett Franklin L
Purchase Details
Closed on
Mar 5, 1993
Bought by
Jett Frankie L and Jett Connie
Purchase Details
Closed on
Oct 3, 1991
Bought by
Jobe Thomas Loval and Jobe Debra
Create a Home Valuation Report for This Property
The Home Valuation Report is an in-depth analysis detailing your home's value as well as a comparison with similar homes in the area
Home Values in the Area
Average Home Value in this Area
Purchase History
| Date | Buyer | Sale Price | Title Company |
|---|---|---|---|
| Provance Pllc | $13,000 | -- | |
| Giles Thomas | $15,000 | -- | |
| Gregory Barry | -- | -- | |
| Barry Gregory | -- | -- | |
| Darrell Mceachron | $2,235 | -- | |
| Grieshaber Michael S | $39,900 | -- | |
| Jett Frankie L | -- | -- | |
| Jett Franklin L | -- | -- | |
| Jett Frankie L | $28,000 | -- | |
| Jobe Thomas Loval | $14,000 | -- |
Source: Public Records
Tax History Compared to Growth
Tax History
| Year | Tax Paid | Tax Assessment Tax Assessment Total Assessment is a certain percentage of the fair market value that is determined by local assessors to be the total taxable value of land and additions on the property. | Land | Improvement |
|---|---|---|---|---|
| 2024 | -- | $17,900 | $2,500 | $15,400 |
| 2023 | $556 | $17,900 | $2,500 | $15,400 |
| 2022 | $556 | $17,900 | $2,500 | $15,400 |
| 2021 | $571 | $12,275 | $1,250 | $11,025 |
| 2020 | $571 | $12,275 | $1,250 | $11,025 |
| 2019 | $553 | $12,275 | $1,250 | $11,025 |
| 2018 | $547 | $12,275 | $1,250 | $11,025 |
| 2017 | $547 | $12,275 | $1,250 | $11,025 |
| 2016 | $523 | $10,225 | $1,375 | $8,850 |
| 2015 | $478 | $10,225 | $1,375 | $8,850 |
| 2014 | $478 | $10,225 | $1,375 | $8,850 |
Source: Public Records
Map
Nearby Homes
- 319 Greenwood St
- 594 5th Ave N
- 627 6th Ave N
- 231 Greenwood St
- 630 6th Ave N
- 638 2nd Ave N
- 543 2nd Ave N
- 0 New Lake Rd Unit RTC3030964
- 726 Thomas Ave
- 316 Haynes St
- 1600 Larry Dospil Dr
- 416 1st Ave N
- 215 5th Ave N
- 319 E Hill Ave
- 518 Maple St
- 525 Maple St
- 1025 Glenn Ave
- 610 Forrest St
- 1144 Apple St
- 1204 Glenn Ave
- 668 Limestone Ave
- 654 Limestone Ave
- 661 5th Ave N
- 665 5th Ave N
- 661 Limestone Ave
- 669 Limestone Ave
- 653 5th Ave N
- 445 Greenwood St
- 673 Limestone Ave
- 653 Limestone Ave
- 647 5th Ave N
- 638 Limestone Ave
- 413 Greenwood St
- 647 Limestone Ave
- 639 5th Ave N
- 664 4th Ave N
- 664 4th Ave N Unit A
- 664 4th Ave N Unit C
- 658 4th Ave N
- 664 N 5th Ave