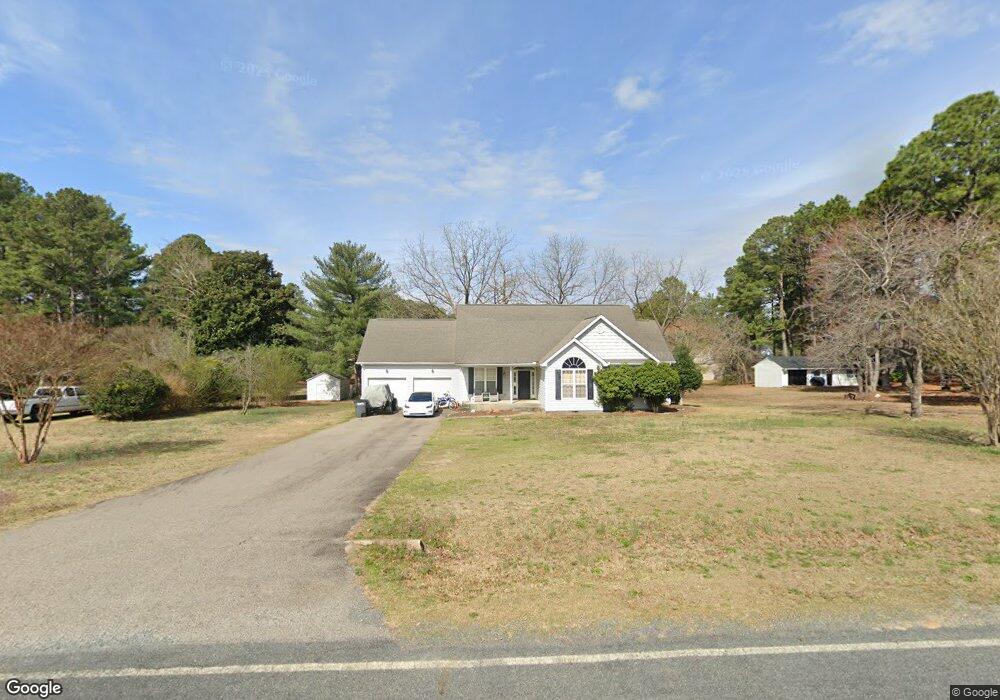
660 Michael Rd Whispering Pines, NC 28327
Estimated Value: $379,000 - $422,000
3
Beds
2
Baths
1,924
Sq Ft
$211/Sq Ft
Est. Value
About This Home
This home is located at 660 Michael Rd, Whispering Pines, NC 28327 and is currently estimated at $405,076, approximately $210 per square foot. 660 Michael Rd is a home located in Moore County with nearby schools including Sandhills Farm Life Elementary School, New Century Middle School, and Union Pines High School.
Ownership History
Date
Name
Owned For
Owner Type
Purchase Details
Closed on
Jul 26, 2005
Sold by
Dicarlo Luigi F G and Dicarlo Jacqueline R
Bought by
Fusco Frederick C and Fusco Mirely
Current Estimated Value
Home Financials for this Owner
Home Financials are based on the most recent Mortgage that was taken out on this home.
Original Mortgage
$194,493
Outstanding Balance
$100,985
Interest Rate
5.48%
Mortgage Type
VA
Estimated Equity
$304,091
Purchase Details
Closed on
Aug 7, 2002
Sold by
Dicarlo Luigi F G
Bought by
Fusco Frederick C and Fusco Mirely
Create a Home Valuation Report for This Property
The Home Valuation Report is an in-depth analysis detailing your home's value as well as a comparison with similar homes in the area
Home Values in the Area
Average Home Value in this Area
Purchase History
| Date | Buyer | Sale Price | Title Company |
|---|---|---|---|
| Fusco Frederick C | $190,500 | None Available | |
| Fusco Frederick C | $155,000 | -- |
Source: Public Records
Mortgage History
| Date | Status | Borrower | Loan Amount |
|---|---|---|---|
| Open | Fusco Frederick C | $194,493 |
Source: Public Records
Tax History
| Year | Tax Paid | Tax Assessment Tax Assessment Total Assessment is a certain percentage of the fair market value that is determined by local assessors to be the total taxable value of land and additions on the property. | Land | Improvement |
|---|---|---|---|---|
| 2024 | $1,337 | $307,300 | $75,000 | $232,300 |
| 2023 | $1,398 | $307,300 | $75,000 | $232,300 |
| 2022 | $1,415 | $224,530 | $52,500 | $172,030 |
| 2021 | $1,471 | $224,530 | $52,500 | $172,030 |
| 2020 | $1,448 | $224,530 | $52,500 | $172,030 |
| 2019 | $1,448 | $224,530 | $52,500 | $172,030 |
| 2018 | $1,264 | $210,620 | $45,000 | $165,620 |
| 2017 | $1,232 | $210,620 | $45,000 | $165,620 |
| 2015 | $1,190 | $210,620 | $45,000 | $165,620 |
| 2014 | $1,064 | $196,010 | $34,880 | $161,130 |
| 2013 | -- | $196,010 | $34,880 | $161,130 |
Source: Public Records
Map
Nearby Homes
- 255 Foxcroft Rd
- 370 Michael Rd
- 150 Rothbury Dr
- 13 Banning Dr
- 125 Dublin Ct
- Devon Plan at Ravensbrook
- Cadogan Plan at Ravensbrook
- Downton Plan at Ravensbrook
- Grantham Plan at Ravensbrook
- 33 Banning Dr
- 1 Kenilwood Ct
- 32 Elkton Dr
- 36 Birdie Dr
- 12 Hemlock Ct
- 1336 McCaskill Rd
- 111 Hammerstone Cir
- 41 Middlebury Rd
- 54 Pine Ridge Dr
- 4 Woodward Place
- 25 Middlebury