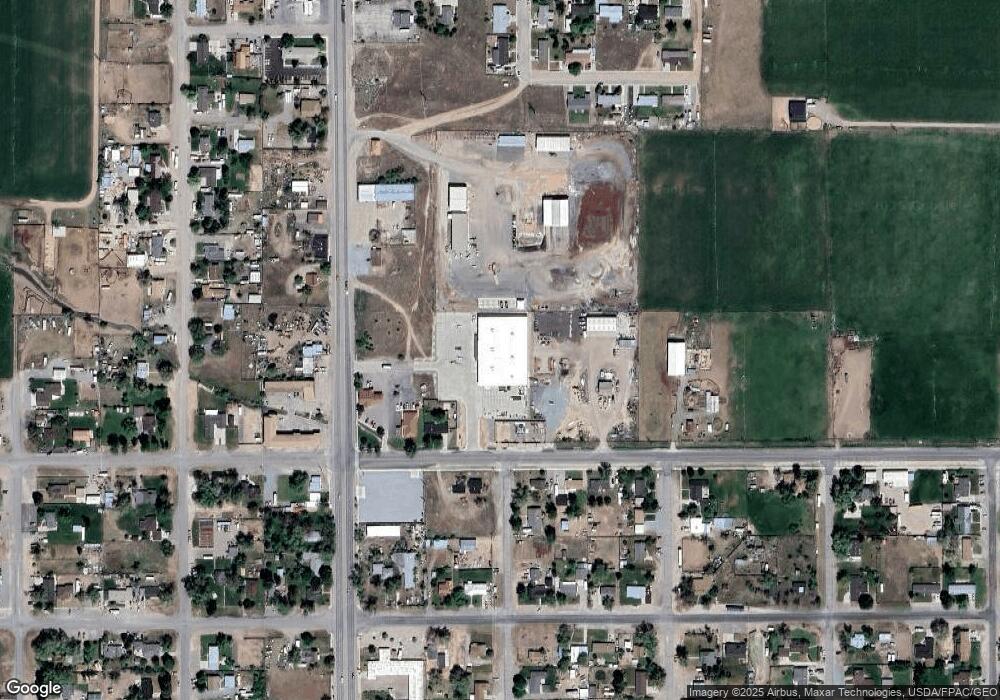
660 N Main St Beaver, UT 84713
Estimated Value: $1,113,122
--
Bed
--
Bath
31,500
Sq Ft
$35/Sq Ft
Est. Value
About This Home
This home is located at 660 N Main St, Beaver, UT 84713 and is currently estimated at $1,113,122, approximately $35 per square foot. 660 N Main St is a home located in Beaver County with nearby schools including Belknap School and Beaver High School.
Ownership History
Date
Name
Owned For
Owner Type
Purchase Details
Closed on
Dec 30, 2020
Sold by
Zions Bancorporation Na
Bought by
Reese Real Estate & Investment Company
Current Estimated Value
Purchase Details
Closed on
Aug 20, 2020
Sold by
Mayfield Michael D
Bought by
Zions Bancorporation Na and Zions First National Bank
Purchase Details
Closed on
Oct 24, 2018
Sold by
Fd Properties 9 Llc
Bought by
Fredrickson Deborah J
Home Financials for this Owner
Home Financials are based on the most recent Mortgage that was taken out on this home.
Original Mortgage
$814,000
Interest Rate
4.6%
Mortgage Type
Commercial
Purchase Details
Closed on
May 29, 2009
Sold by
Titlefirst Title Insurance Agency Llc
Bought by
Duckwall Alco Stores Inc
Purchase Details
Closed on
Mar 17, 2008
Sold by
Titlefirst Title Insurance Agency Llc
Bought by
Beaver City Corp
Create a Home Valuation Report for This Property
The Home Valuation Report is an in-depth analysis detailing your home's value as well as a comparison with similar homes in the area
Home Values in the Area
Average Home Value in this Area
Purchase History
| Date | Buyer | Sale Price | Title Company |
|---|---|---|---|
| Reese Real Estate & Investment Company | -- | Old Republic Title | |
| Zions Bancorporation Na | -- | None Available | |
| Fredrickson Deborah J | -- | Stewart Title Insurance Agen | |
| Duckwall Alco Stores Inc | -- | -- | |
| Beaver City Corp | -- | -- |
Source: Public Records
Mortgage History
| Date | Status | Borrower | Loan Amount |
|---|---|---|---|
| Previous Owner | Fredrickson Deborah J | $814,000 |
Source: Public Records
Tax History Compared to Growth
Tax History
| Year | Tax Paid | Tax Assessment Tax Assessment Total Assessment is a certain percentage of the fair market value that is determined by local assessors to be the total taxable value of land and additions on the property. | Land | Improvement |
|---|---|---|---|---|
| 2024 | $11,543 | $1,464,468 | $110,633 | $1,353,835 |
| 2023 | $11,940 | $1,464,468 | $110,633 | $1,353,835 |
| 2022 | $12,072 | $1,464,468 | $110,633 | $1,353,835 |
| 2021 | $11,960 | $1,400,000 | $110,633 | $1,289,367 |
| 2020 | $15,312 | $1,760,001 | $110,633 | $1,649,368 |
| 2019 | $17,088 | $2,035,000 | $100,575 | $1,934,425 |
| 2018 | $17,845 | $2,035,000 | $100,575 | $1,934,425 |
| 2017 | $17,845 | $2,088,026 | $100,575 | $1,987,451 |
| 2016 | $19,047 | $2,088,026 | $0 | $0 |
| 2015 | $19,300 | $2,088,025 | $0 | $0 |
| 2014 | $19,448 | $2,088,025 | $0 | $0 |
| 2013 | $20,337 | $2,088,025 | $0 | $0 |
Source: Public Records
Map
Nearby Homes