Estimated Value: $204,000 - $216,000
3
Beds
2
Baths
1,500
Sq Ft
$141/Sq Ft
Est. Value
About This Home
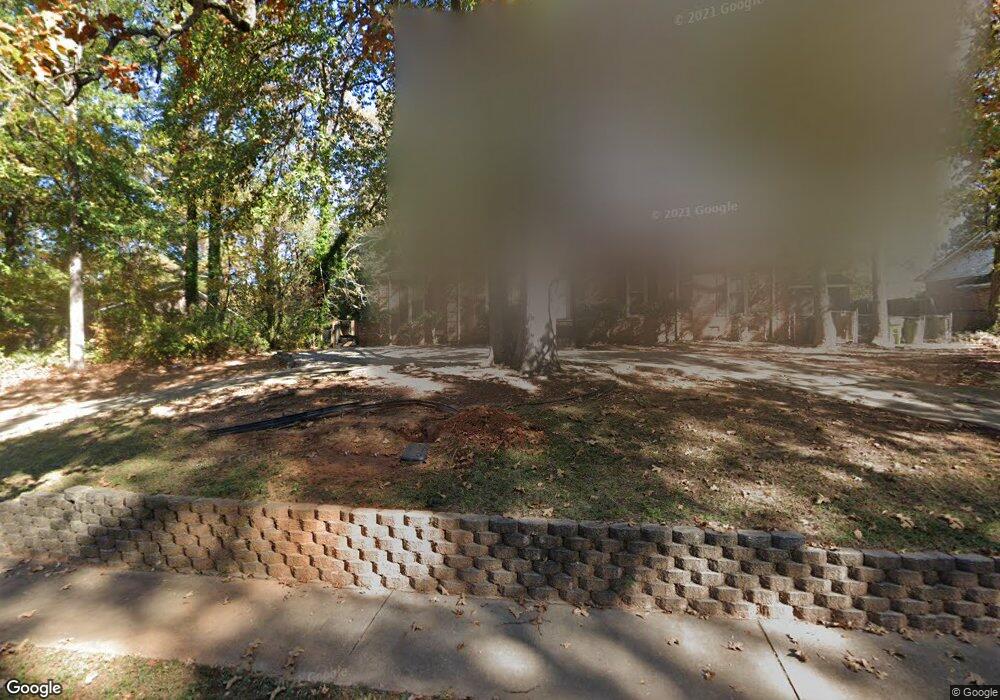
This home is located at 660 N Royal Tower Dr, Irmo, SC 29063 and is currently estimated at $210,931, approximately $140 per square foot. 660 N Royal Tower Dr is a home located in Lexington County with nearby schools including H. E. Corley Elementary School, Dutch Fork Middle School, and Dutch Fork High School.
Ownership History
Date
Name
Owned For
Owner Type
Purchase Details
Closed on
Aug 17, 2018
Sold by
Labrecque Ronald
Bought by
Mccoy Yazmin
Current Estimated Value
Home Financials for this Owner
Home Financials are based on the most recent Mortgage that was taken out on this home.
Original Mortgage
$122,637
Outstanding Balance
$108,188
Interest Rate
5.62%
Mortgage Type
FHA
Estimated Equity
$102,743
Purchase Details
Closed on
Nov 1, 2004
Sold by
Wilson William J
Bought by
Labrecque Ronald
Purchase Details
Closed on
Apr 1, 2003
Sold by
Clawson Anita J
Bought by
Smiddy Garrick S
Purchase Details
Closed on
Mar 12, 2003
Sold by
Citifinancial Mortgage Inc
Bought by
Wilson William J
Purchase Details
Closed on
Nov 4, 2002
Sold by
Deer Moss Est Llc
Bought by
Mogadam Fariba Wafaee
Create a Home Valuation Report for This Property
The Home Valuation Report is an in-depth analysis detailing your home's value as well as a comparison with similar homes in the area
Home Values in the Area
Average Home Value in this Area
Purchase History
| Date | Buyer | Sale Price | Title Company |
|---|---|---|---|
| Mccoy Yazmin | $124,900 | None Available | |
| Labrecque Ronald | $87,500 | -- | |
| Smiddy Garrick S | $103,900 | -- | |
| Wilson William J | $72,000 | -- | |
| Mogadam Fariba Wafaee | $17,200 | -- |
Source: Public Records
Mortgage History
| Date | Status | Borrower | Loan Amount |
|---|---|---|---|
| Open | Mccoy Yazmin | $122,637 |
Source: Public Records
Tax History
| Year | Tax Paid | Tax Assessment Tax Assessment Total Assessment is a certain percentage of the fair market value that is determined by local assessors to be the total taxable value of land and additions on the property. | Land | Improvement |
|---|---|---|---|---|
| 2024 | $1,196 | $5,080 | $1,000 | $4,080 |
| 2023 | $1,125 | $5,080 | $1,000 | $4,080 |
| 2022 | $1,095 | $5,080 | $1,000 | $4,080 |
| 2020 | $1,070 | $4,996 | $1,000 | $3,996 |
| 2019 | $1,057 | $4,996 | $800 | $4,196 |
| 2018 | $2,294 | $5,030 | $1,200 | $3,830 |
| 2017 | $2,246 | $5,030 | $1,200 | $3,830 |
| 2016 | $2,234 | $5,030 | $1,200 | $3,830 |
| 2014 | $2,185 | $5,564 | $1,050 | $4,514 |
| 2013 | -- | $5,560 | $1,050 | $4,510 |
Source: Public Records
Map
Nearby Homes
- 679 N Royal Tower Dr
- 712 N Royal Tower Dr
- 318 Maid Stone Rd
- 337 Chapelwhite Rd
- 415 Cressfell Rd
- 112 Hayburg Dr
- 410 Cressfell Rd
- 242 Greenstone Way
- 500 Cockspur Rd
- 116 River Song Rd
- 25 Dyers Hall Ct
- 129 Drakewood Dr
- 418 Cockspur Rd
- 108 Gales River Rd
- 706 Chadford Rd
- 10 Cockspur Cir
- 304 Wayworth Ct
- 338 Silver Anchor Dr
- 202 Sandstone Ct
- 305 Wharfsdale Rd
- 654 N Royal Tower Dr
- 664 N Royal Tower Dr
- 161 Casco Bay Rd
- 167 Casco Bay Rd
- 648 N Royal Tower Dr
- 672 N Royal Tower Dr
- 667 N Royal Tower Dr
- 173 Casco Bay Rd
- 155 Casco Bay Rd
- 661 N Royal Tower Dr
- 673 N Royal Tower Dr
- 655 N Royal Tower Dr
- 642 N Royal Tower Dr
- 680 N Royal Tower Dr
- 649 N Royal Tower Dr
- 213 Cressfell Rd
- 149 Casco Bay Rd
- 154 Casco Bay Rd
- 160 Casco Bay Rd
- 685 N Royal Tower Dr
Your Personal Tour Guide
Ask me questions while you tour the home.