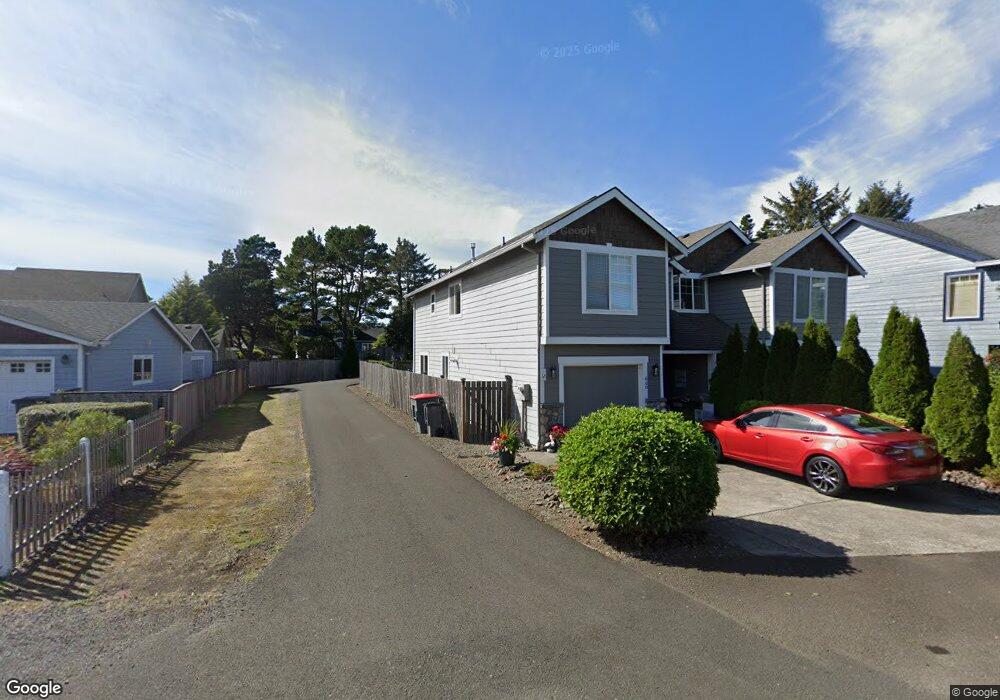
660 Necanicum Dr Unit 2 Seaside, OR 97138
Estimated Value: $506,395 - $560,000
3
Beds
3
Baths
1,471
Sq Ft
$367/Sq Ft
Est. Value
About This Home
This home is located at 660 Necanicum Dr Unit 2, Seaside, OR 97138 and is currently estimated at $540,349, approximately $367 per square foot. 660 Necanicum Dr Unit 2 is a home located in Clatsop County with nearby schools including Seaside High School.
Ownership History
Date
Name
Owned For
Owner Type
Purchase Details
Closed on
Dec 14, 2020
Sold by
Brewer Steven V and Brewer Debra L
Bought by
Brewer Steven V and Brewer Debra L
Current Estimated Value
Purchase Details
Closed on
Oct 28, 2013
Sold by
Next Level Construction Llc
Bought by
Brewer Steven and Brewer Debra L
Home Financials for this Owner
Home Financials are based on the most recent Mortgage that was taken out on this home.
Original Mortgage
$188,000
Outstanding Balance
$141,010
Interest Rate
4.53%
Mortgage Type
New Conventional
Estimated Equity
$399,339
Purchase Details
Closed on
Sep 28, 2005
Sold by
Catanese Joseph R
Bought by
Whitney Brian L and Whitney Marcell L
Home Financials for this Owner
Home Financials are based on the most recent Mortgage that was taken out on this home.
Original Mortgage
$299,250
Interest Rate
3.12%
Mortgage Type
Fannie Mae Freddie Mac
Create a Home Valuation Report for This Property
The Home Valuation Report is an in-depth analysis detailing your home's value as well as a comparison with similar homes in the area
Home Values in the Area
Average Home Value in this Area
Purchase History
| Date | Buyer | Sale Price | Title Company |
|---|---|---|---|
| Brewer Steven V | -- | None Available | |
| Brewer Steven | $235,000 | Multiple | |
| Whitney Brian L | $315,000 | Ticor Title Ins Co |
Source: Public Records
Mortgage History
| Date | Status | Borrower | Loan Amount |
|---|---|---|---|
| Open | Brewer Steven | $188,000 | |
| Previous Owner | Whitney Brian L | $299,250 |
Source: Public Records
Tax History Compared to Growth
Tax History
| Year | Tax Paid | Tax Assessment Tax Assessment Total Assessment is a certain percentage of the fair market value that is determined by local assessors to be the total taxable value of land and additions on the property. | Land | Improvement |
|---|---|---|---|---|
| 2025 | $4,523 | $314,781 | -- | -- |
| 2024 | $4,390 | $305,613 | -- | -- |
| 2023 | $4,261 | $296,712 | $0 | $0 |
| 2022 | $4,144 | $288,071 | $0 | $0 |
| 2021 | $4,056 | $279,682 | $0 | $0 |
| 2020 | $3,944 | $271,537 | $0 | $0 |
| 2019 | $3,772 | $263,629 | $0 | $0 |
| 2018 | $3,643 | $255,952 | $0 | $0 |
| 2017 | $3,317 | $248,498 | $0 | $0 |
| 2016 | $3,122 | $242,474 | $86,055 | $156,419 |
| 2015 | $3,041 | $235,413 | $83,549 | $151,864 |
| 2014 | $3,032 | $228,557 | $0 | $0 |
| 2013 | -- | $201,600 | $0 | $0 |
Source: Public Records
Map
Nearby Homes
- 662 Necanicum Dr Unit 1
- 688 Necanicum Dr
- 636 Necanicum Dr
- 450 6th Ave
- 430 7th Ave
- 629 N Franklin St
- 407 7th Ave
- 615 N Franklin St
- 709 N Franklin St
- 570 Necanicum Dr
- 711 N Franklin St
- 339 7th Ave
- 475 8th Ave Unit 104
- 475 8th Ave Unit 103
- 475 8th Ave Unit 102
- 475 8th Ave Unit 3
- 475 8th Ave
- 475 8th Ave Unit 4
- 475 8th Ave Unit 101
- 340 6th Ave