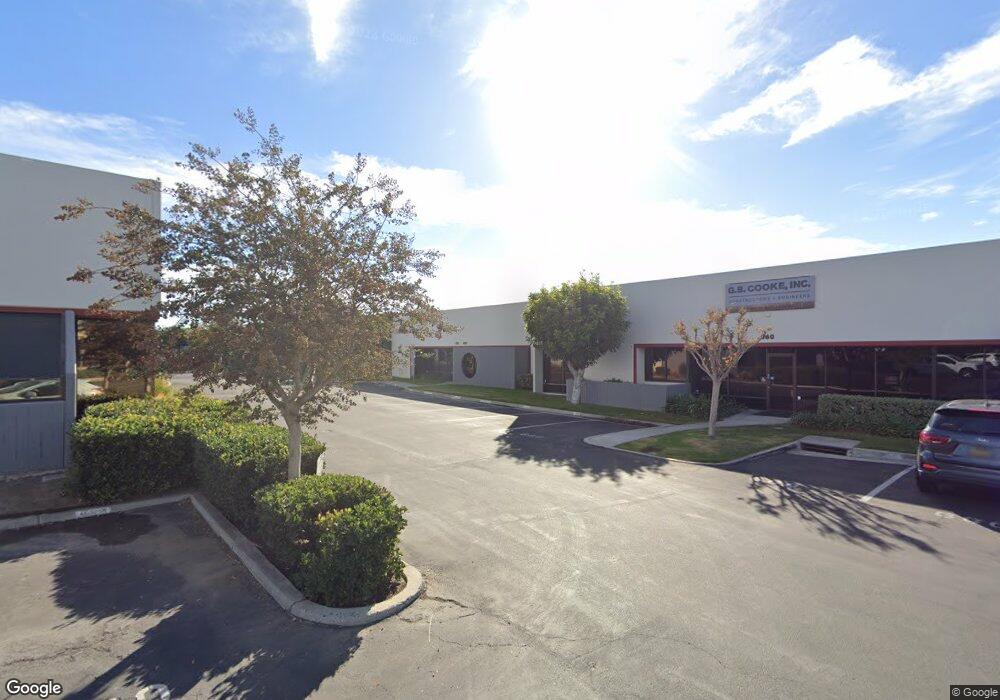
660 S State College Blvd Unit F1A Fullerton, CA 92831
--
Bed
--
Bath
3,720
Sq Ft
8,276
Sq Ft Lot
About This Home
This home is located at 660 S State College Blvd Unit F1A, Fullerton, CA 92831. 660 S State College Blvd Unit F1A is a home located in Orange County with nearby schools including Commonwealth Elementary School, Ladera Vista Junior High School, and Troy High School.
Ownership History
Date
Name
Owned For
Owner Type
Purchase Details
Closed on
Aug 12, 2016
Sold by
Fb 660 South State College Llc
Bought by
Kc 660 Properties Llc
Purchase Details
Closed on
May 8, 2008
Sold by
Jrdh Real Estate Llc
Bought by
Fb 660 South State College Llc
Home Financials for this Owner
Home Financials are based on the most recent Mortgage that was taken out on this home.
Original Mortgage
$700,000
Interest Rate
5.99%
Mortgage Type
Purchase Money Mortgage
Purchase Details
Closed on
Apr 5, 2005
Sold by
Ropak Corp
Bought by
Jrdh Real Estate Llc
Home Financials for this Owner
Home Financials are based on the most recent Mortgage that was taken out on this home.
Original Mortgage
$775,000
Interest Rate
5.7%
Mortgage Type
Commercial
Purchase Details
Closed on
Sep 1, 1995
Sold by
Six Sixty Ltd
Bought by
Ropak Corp
Create a Home Valuation Report for This Property
The Home Valuation Report is an in-depth analysis detailing your home's value as well as a comparison with similar homes in the area
Home Values in the Area
Average Home Value in this Area
Purchase History
| Date | Buyer | Sale Price | Title Company |
|---|---|---|---|
| Kc 660 Properties Llc | $1,043,500 | Ticor Title | |
| Fb 660 South State College Llc | $1,440,000 | First American Title Company | |
| Jrdh Real Estate Llc | -- | First American Title Ins Co | |
| Ropak Corp | $390,000 | -- |
Source: Public Records
Mortgage History
| Date | Status | Borrower | Loan Amount |
|---|---|---|---|
| Previous Owner | Fb 660 South State College Llc | $700,000 | |
| Previous Owner | Jrdh Real Estate Llc | $775,000 |
Source: Public Records
Tax History Compared to Growth
Tax History
| Year | Tax Paid | Tax Assessment Tax Assessment Total Assessment is a certain percentage of the fair market value that is determined by local assessors to be the total taxable value of land and additions on the property. | Land | Improvement |
|---|---|---|---|---|
| 2025 | $6,716 | $605,242 | $348,177 | $257,065 |
| 2024 | $6,716 | $593,375 | $341,350 | $252,025 |
| 2023 | $6,555 | $581,741 | $334,657 | $247,084 |
| 2022 | $6,512 | $570,335 | $328,095 | $242,240 |
| 2021 | $6,400 | $559,152 | $321,661 | $237,491 |
| 2020 | $6,365 | $553,419 | $318,363 | $235,056 |
| 2019 | $6,199 | $542,568 | $312,120 | $230,448 |
| 2018 | $6,106 | $531,930 | $306,000 | $225,930 |
| 2017 | $6,005 | $521,500 | $300,000 | $221,500 |
| 2016 | $7,728 | $681,823 | $550,645 | $131,178 |
| 2015 | $7,512 | $671,582 | $542,374 | $129,208 |
| 2014 | -- | $658,427 | $531,750 | $126,677 |
Source: Public Records
Map
Nearby Homes
- 2334 E Santa fe Ave
- 2431 Santa Ysabel Ave
- 820 Cardinal St
- 712 Oriole Ave
- 1756 E Commonwealth Ave Unit 101
- 2616 Balfour Ave
- 2220 E Chapman Ave Unit 11
- 1909 E Wilshire Ave
- 906 Easton St
- 400 N Acacia Ave Unit B10
- 400 N Acacia Ave Unit C33
- 400 N Acacia Ave
- 400 N Acacia Ave Unit A13
- 400 N Acacia Ave Unit B24
- 400 N Acacia Ave Unit B12
- 400 N Acacia Ave Unit D35
- 1556 E Benmore Ln
- 313 N Acacia Ave Unit c
- 1250 N State College Blvd Unit 19
- 1730 E Park Ln Unit 17
- 660 S State College Blvd Unit F1B
- 626 S State College Blvd Unit A17B
- 626 S State College Blvd Unit A17A
- 634 S State College Blvd Unit A5B
- 634 S State College Blvd Unit A5A
- 570 S State College Blvd Unit E12B
- 570 S State College Blvd Unit E12A
- 566 S State College Blvd Unit B11A
- 566 S State College Blvd Unit B11B
- 620 S State College Blvd Unit D18A
- 620 S State College Blvd Unit D18B
- 578 S State College Blvd Unit 278
- 560 S State College Blvd Unit D10B
- 560 S State College Blvd Unit D10A
- 638 S State College Blvd Unit C4A
- 638 S State College Blvd Unit C4B
- 616 S State College Blvd Unit B19B
- 616 S State College Blvd Unit B19A
- 580 S State College Blvd Unit C13B
- 556 S State College Blvd Unit A9A