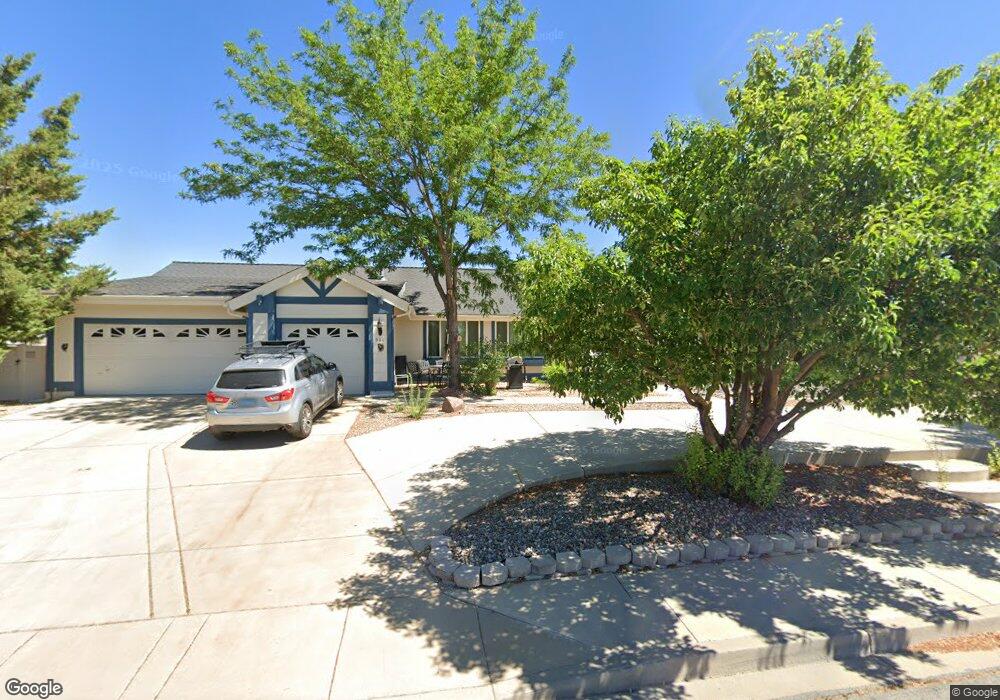
660 Tranquil Dr Sparks, NV 89441
Sky Ranch NeighborhoodEstimated Value: $859,845 - $975,000
4
Beds
3
Baths
2,464
Sq Ft
$374/Sq Ft
Est. Value
About This Home
This home is located at 660 Tranquil Dr, Sparks, NV 89441 and is currently estimated at $921,711, approximately $374 per square foot. 660 Tranquil Dr is a home located in Washoe County with nearby schools including Spanish Springs Elementary School, Yvonne Shaw Middle School, and Spanish Springs High School.
Ownership History
Date
Name
Owned For
Owner Type
Purchase Details
Closed on
Apr 14, 2020
Sold by
Buell Charles N and The Buell Family Trust
Bought by
Buell Charles N and The Buell Family Trust
Current Estimated Value
Home Financials for this Owner
Home Financials are based on the most recent Mortgage that was taken out on this home.
Original Mortgage
$255,000
Outstanding Balance
$224,475
Interest Rate
3.3%
Mortgage Type
New Conventional
Estimated Equity
$697,236
Purchase Details
Closed on
Dec 22, 2011
Sold by
Buell Charles N and Buell Chiyoko
Bought by
Buell Charles N and Buell Chiyoko
Home Financials for this Owner
Home Financials are based on the most recent Mortgage that was taken out on this home.
Original Mortgage
$270,750
Interest Rate
3.94%
Mortgage Type
New Conventional
Purchase Details
Closed on
Dec 19, 2011
Sold by
Buell Charles N and Buell Chiyoko
Bought by
Buell Charles N and Buell Chiyoko
Home Financials for this Owner
Home Financials are based on the most recent Mortgage that was taken out on this home.
Original Mortgage
$270,750
Interest Rate
3.94%
Mortgage Type
New Conventional
Purchase Details
Closed on
Aug 1, 2005
Sold by
Buell Charles N and Buell Chiyoko
Bought by
Buell Charles N and Buell Chiyoko
Home Financials for this Owner
Home Financials are based on the most recent Mortgage that was taken out on this home.
Original Mortgage
$295,000
Interest Rate
6.12%
Mortgage Type
New Conventional
Purchase Details
Closed on
Jul 21, 2005
Sold by
Hanson Chris Albert and Hanson Cleo Ada
Bought by
Buell Charles N and Buell Chiyoko
Home Financials for this Owner
Home Financials are based on the most recent Mortgage that was taken out on this home.
Original Mortgage
$295,000
Interest Rate
6.12%
Mortgage Type
New Conventional
Purchase Details
Closed on
Dec 21, 2001
Sold by
Hanson Chris Albert and Hanson Cleo Ada
Bought by
Hanson Chris Albert and Hanson Cleo Ada
Home Financials for this Owner
Home Financials are based on the most recent Mortgage that was taken out on this home.
Original Mortgage
$196,717
Interest Rate
6.51%
Purchase Details
Closed on
Jul 29, 1998
Sold by
Hanson Chris A and Hanson Cleo Ada
Bought by
Hanson Chris Albert and Hanson Cleo Ada
Purchase Details
Closed on
Dec 26, 1996
Sold by
Oakspring Associates
Bought by
Hanson Chris A and Hanson Cleo Ada
Home Financials for this Owner
Home Financials are based on the most recent Mortgage that was taken out on this home.
Original Mortgage
$203,000
Interest Rate
7.58%
Mortgage Type
VA
Create a Home Valuation Report for This Property
The Home Valuation Report is an in-depth analysis detailing your home's value as well as a comparison with similar homes in the area
Home Values in the Area
Average Home Value in this Area
Purchase History
| Date | Buyer | Sale Price | Title Company |
|---|---|---|---|
| Buell Charles N | -- | First American Title Sparks | |
| Buell Charles N | -- | Western Title Company | |
| Buell Charles N | -- | Accommodation | |
| Buell Charles N | -- | Stewart Title Of Northern Nv | |
| Buell Charles N | $535,000 | Stewart Title Of Northern Nv | |
| Hanson Chris Albert | -- | First American Title | |
| Hanson Chris Albert | -- | -- | |
| Hanson Chris A | $207,000 | First American Title Co |
Source: Public Records
Mortgage History
| Date | Status | Borrower | Loan Amount |
|---|---|---|---|
| Open | Buell Charles N | $255,000 | |
| Closed | Buell Charles N | $270,750 | |
| Closed | Buell Charles N | $295,000 | |
| Previous Owner | Hanson Chris Albert | $196,717 | |
| Previous Owner | Hanson Chris A | $203,000 |
Source: Public Records
Tax History
| Year | Tax Paid | Tax Assessment Tax Assessment Total Assessment is a certain percentage of the fair market value that is determined by local assessors to be the total taxable value of land and additions on the property. | Land | Improvement |
|---|---|---|---|---|
| 2026 | $2,803 | $161,774 | $68,880 | $92,894 |
| 2024 | $3,625 | $150,655 | $54,635 | $96,020 |
| 2023 | $3,520 | $144,403 | $53,795 | $90,608 |
| 2022 | $3,417 | $125,172 | $49,525 | $75,647 |
| 2021 | $3,318 | $114,583 | $39,060 | $75,523 |
| 2020 | $3,220 | $110,854 | $35,070 | $75,784 |
| 2019 | $3,126 | $108,345 | $34,930 | $73,415 |
| 2018 | $3,035 | $95,741 | $23,660 | $72,081 |
| 2017 | $2,946 | $94,364 | $21,980 | $72,384 |
| 2016 | $2,872 | $93,347 | $19,425 | $73,922 |
| 2015 | $2,866 | $92,899 | $19,005 | $73,894 |
| 2014 | $2,782 | $87,725 | $16,310 | $71,415 |
| 2013 | -- | $83,367 | $13,125 | $70,242 |
Source: Public Records
Map
Nearby Homes
- 25 Martell Place Unit 6
- 291 Omni Dr
- 705 Tranquil Dr
- 322 Omni Dr
- 415 Sunset Springs Ln
- 0 El Cid
- 75 Wootton Downs Dr
- 2330 Hickory Dr
- 2319 Hickory Dr Unit 77
- 2382 Seaberry Dr Unit 97
- 25 Nives Ct
- 2525 Coltra Springs Dr
- 55 Nives Ct
- 11641 Vista Park Dr
- 742 Mallard Crest Dr
- 309 Coyote Crossing
- 2352 Millville Dr
- 9580 Benedict Dr
- 60 Rosetta Stone Ct
- 2271 Slater Mill Dr
- 650 Tranquil Dr
- 670 Tranquil Dr
- 655 Tranquil Dr Unit 4
- 665 Tranquil Dr
- 645 Tranquil Dr Unit 4
- 675 Tranquil Dr
- 635 Tranquil Dr
- 15 Martell Place
- 10 Carefree Place
- 625 Tranquil Dr
- 685 Tranquil Dr
- 288 Omni Dr
- 20 Carefree Place
- 35 Martell Place
- 287 Omni Dr
- 290 Omni Dr
- 695 Tranquil Dr Unit 6
- 30 Carefree Place Unit 4
- 289 Omni Dr Unit 6
- 45 Martell Place
Your Personal Tour Guide
Ask me questions while you tour the home.