Estimated Value: $998,000 - $1,280,000
5
Beds
3
Baths
2,414
Sq Ft
$486/Sq Ft
Est. Value
About This Home
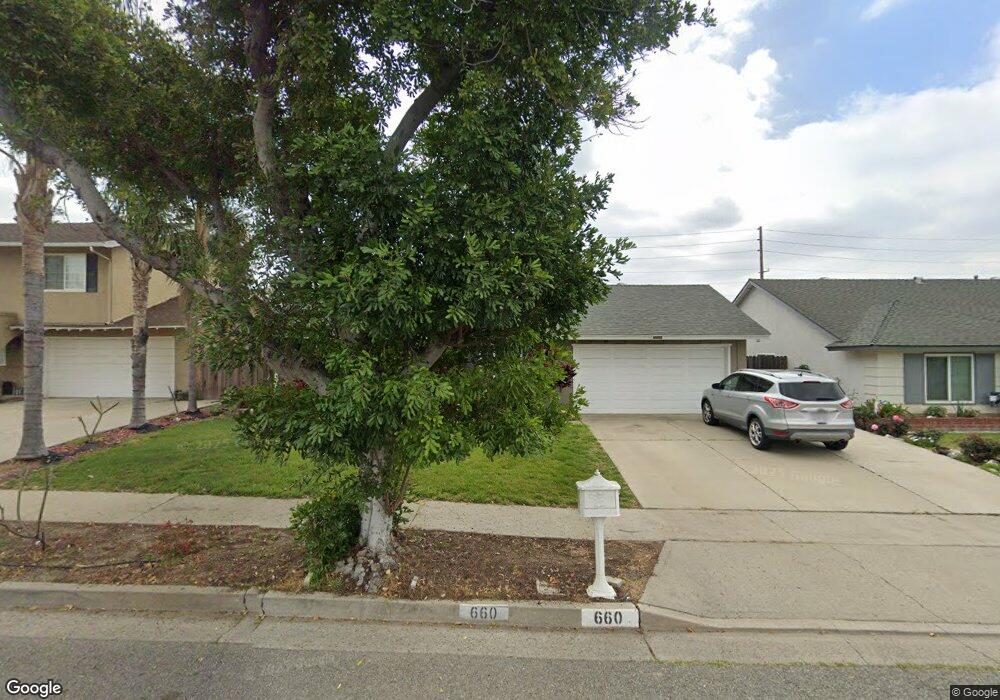
This home is located at 660 Wakeforest St, Brea, CA 92821 and is currently estimated at $1,173,060, approximately $485 per square foot. 660 Wakeforest St is a home located in Orange County with nearby schools including William E. Fanning Elementary School, Brea Junior High School, and Brea-Olinda High School.
Ownership History
Date
Name
Owned For
Owner Type
Purchase Details
Closed on
Aug 12, 2003
Sold by
Lafferty Shawn
Bought by
Ledden Brendan and Ledden Ann Marie
Current Estimated Value
Home Financials for this Owner
Home Financials are based on the most recent Mortgage that was taken out on this home.
Original Mortgage
$310,000
Outstanding Balance
$143,242
Interest Rate
6.3%
Mortgage Type
Purchase Money Mortgage
Estimated Equity
$1,029,818
Purchase Details
Closed on
Jun 25, 1998
Sold by
Lafferty Vivian
Bought by
Lafferty Shawn
Home Financials for this Owner
Home Financials are based on the most recent Mortgage that was taken out on this home.
Original Mortgage
$190,700
Interest Rate
7.01%
Purchase Details
Closed on
Jun 10, 1998
Sold by
Hart Robert D and Hart Olah M
Bought by
Lafferty Shawn and Lafferty Barbara
Home Financials for this Owner
Home Financials are based on the most recent Mortgage that was taken out on this home.
Original Mortgage
$190,700
Interest Rate
7.01%
Create a Home Valuation Report for This Property
The Home Valuation Report is an in-depth analysis detailing your home's value as well as a comparison with similar homes in the area
Home Values in the Area
Average Home Value in this Area
Purchase History
| Date | Buyer | Sale Price | Title Company |
|---|---|---|---|
| Ledden Brendan | $419,500 | Lawyers Title Company | |
| Lafferty Shawn | -- | Orange Coast Title | |
| Lafferty Shawn | $212,000 | Orange Coast Title |
Source: Public Records
Mortgage History
| Date | Status | Borrower | Loan Amount |
|---|---|---|---|
| Open | Ledden Brendan | $310,000 | |
| Previous Owner | Lafferty Shawn | $190,700 |
Source: Public Records
Tax History
| Year | Tax Paid | Tax Assessment Tax Assessment Total Assessment is a certain percentage of the fair market value that is determined by local assessors to be the total taxable value of land and additions on the property. | Land | Improvement |
|---|---|---|---|---|
| 2025 | $7,635 | $681,205 | $485,730 | $195,475 |
| 2024 | $7,635 | $667,849 | $476,206 | $191,643 |
| 2023 | $7,424 | $654,754 | $466,868 | $187,886 |
| 2022 | $7,354 | $641,916 | $457,714 | $184,202 |
| 2021 | $7,215 | $629,330 | $448,739 | $180,591 |
| 2020 | $6,995 | $607,374 | $444,137 | $163,237 |
| 2019 | $6,819 | $596,681 | $435,428 | $161,253 |
| 2018 | $6,558 | $570,695 | $426,890 | $143,805 |
| 2017 | $6,272 | $544,892 | $418,519 | $126,373 |
| 2016 | $5,813 | $503,834 | $410,313 | $93,521 |
| 2015 | $5,731 | $496,266 | $404,149 | $92,117 |
| 2014 | $5,449 | $476,000 | $391,711 | $84,289 |
Source: Public Records
Map
Nearby Homes
- 688 Buttonwood Dr
- 360 Meadow Ct
- 570 Olive Ave
- 500 Silver Canyon Way
- 640 Cliffwood Ave
- 673 Cliffwood Ave
- 38 Rogers Ct
- 600 N Brea Blvd Unit 50
- 145 S Poplar Ave Unit 20
- 600 Pepper Tree Dr
- 127 S Redwood Ave
- 136 Donnybrook Rd
- 714 Brooklyn Dr
- 1002 Mariposa Dr
- 2304 Carrotwood Dr
- 753 Site Dr
- 1796 Ravencrest Dr
- 448 W Central Ave
- 2418 Rainbow Ln
- 334 S Walnut Ave
- 650 Wakeforest St
- 670 Wakeforest St
- 642 Wakeforest St
- 680 Wakeforest St
- 530 Cycod Place
- 628 Wakeforest St
- 525 Cashew Ave
- 535 Cycod Place
- 618 Wakeforest St
- 545 Cashew Ave
- 540 Cycod Place
- 518 Cashew Ave
- 510 Cashew Ave
- 595 Aspen St
- 526 Cashew Ave
- 550 Cycod Place
- 545 Cycod Place
- 602 Wakeforest St
- 555 Cashew Ave
- 534 Cashew Ave
Your Personal Tour Guide
Ask me questions while you tour the home.