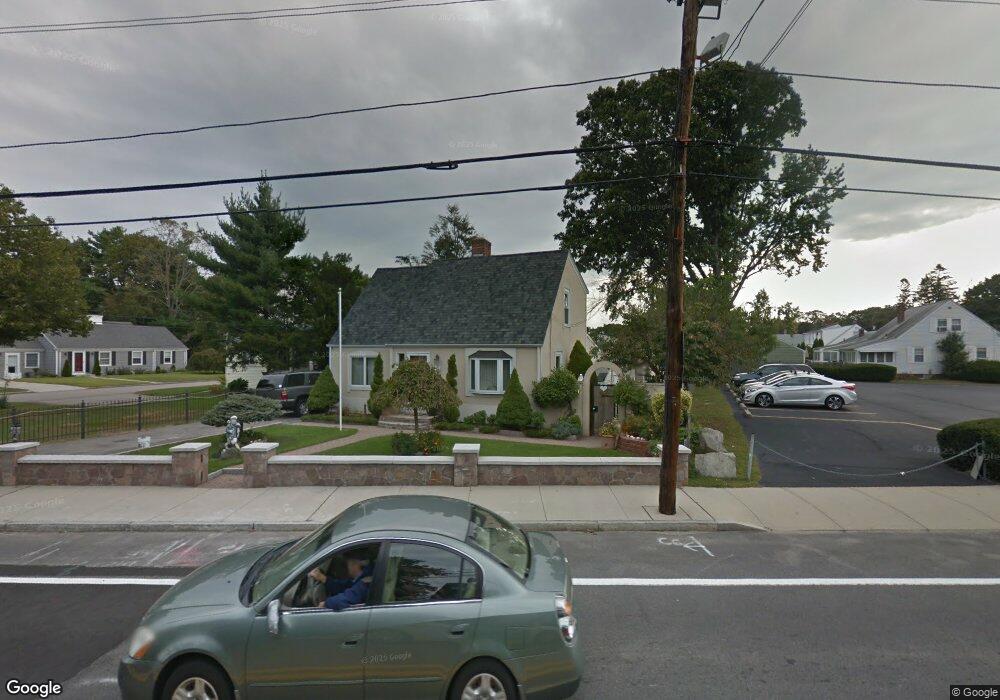
660 Willett Ave Riverside, RI 02915
Riverside NeighborhoodEstimated Value: $502,000 - $540,000
3
Beds
2
Baths
1,973
Sq Ft
$261/Sq Ft
Est. Value
About This Home
This home is located at 660 Willett Ave, Riverside, RI 02915 and is currently estimated at $515,406, approximately $261 per square foot. 660 Willett Ave is a home located in Providence County with nearby schools including East Providence High School, St Luke Elementary School, and St Mary Academy-Bay View.
Ownership History
Date
Name
Owned For
Owner Type
Purchase Details
Closed on
Feb 23, 2012
Sold by
Pimentel Peter M and Pimentel Joana M
Bought by
Pimentel Joanne M
Current Estimated Value
Purchase Details
Closed on
Apr 29, 1994
Sold by
Fhlmc
Bought by
Pimental Pedro M and Pimental Joana
Home Financials for this Owner
Home Financials are based on the most recent Mortgage that was taken out on this home.
Original Mortgage
$96,200
Interest Rate
7.7%
Mortgage Type
Purchase Money Mortgage
Create a Home Valuation Report for This Property
The Home Valuation Report is an in-depth analysis detailing your home's value as well as a comparison with similar homes in the area
Home Values in the Area
Average Home Value in this Area
Purchase History
| Date | Buyer | Sale Price | Title Company |
|---|---|---|---|
| Pimentel Joanne M | -- | -- | |
| Pimental Pedro M | $100,000 | -- | |
| Pimentel Joanne M | -- | -- | |
| Pimental Pedro M | $100,000 | -- |
Source: Public Records
Mortgage History
| Date | Status | Borrower | Loan Amount |
|---|---|---|---|
| Open | Pimental Pedro M | $193,300 | |
| Previous Owner | Pimental Pedro M | $200,000 | |
| Previous Owner | Pimental Pedro M | $96,200 |
Source: Public Records
Tax History Compared to Growth
Tax History
| Year | Tax Paid | Tax Assessment Tax Assessment Total Assessment is a certain percentage of the fair market value that is determined by local assessors to be the total taxable value of land and additions on the property. | Land | Improvement |
|---|---|---|---|---|
| 2025 | $7,149 | $547,000 | $122,400 | $424,600 |
| 2024 | $7,125 | $464,800 | $102,000 | $362,800 |
| 2023 | $6,860 | $464,800 | $102,000 | $362,800 |
| 2022 | $5,946 | $272,000 | $58,400 | $213,600 |
| 2021 | $5,848 | $272,000 | $55,300 | $216,700 |
| 2020 | $5,600 | $272,000 | $55,300 | $216,700 |
| 2019 | $5,445 | $272,000 | $55,300 | $216,700 |
| 2018 | $5,409 | $236,400 | $53,700 | $182,700 |
| 2017 | $5,288 | $236,400 | $53,700 | $182,700 |
| 2016 | $5,262 | $236,400 | $53,700 | $182,700 |
| 2015 | $5,203 | $226,700 | $49,800 | $176,900 |
| 2014 | $5,203 | $226,700 | $49,800 | $176,900 |
Source: Public Records
Map
Nearby Homes
- 25 Winslow St
- 25 Woodbine St
- 735 Willett Ave Unit 806
- 36 Woodbine St
- 536 Willett Ave
- 146 Becker Ave
- 57 Harris St
- 81 Pine Crest Dr
- 83 Pine Crest Dr
- 6 Hilton Ave
- 25 Arnold St
- 81 Sprague Ave
- 85 Hilton Ave
- 151 Willett Ave Unit 2
- 151 Willett Ave Unit 5
- 5 Booth Ave
- 17 Oak Ave
- 33 Pine St Unit 35
- 1 Holly St
- 46 Tanglewood Dr