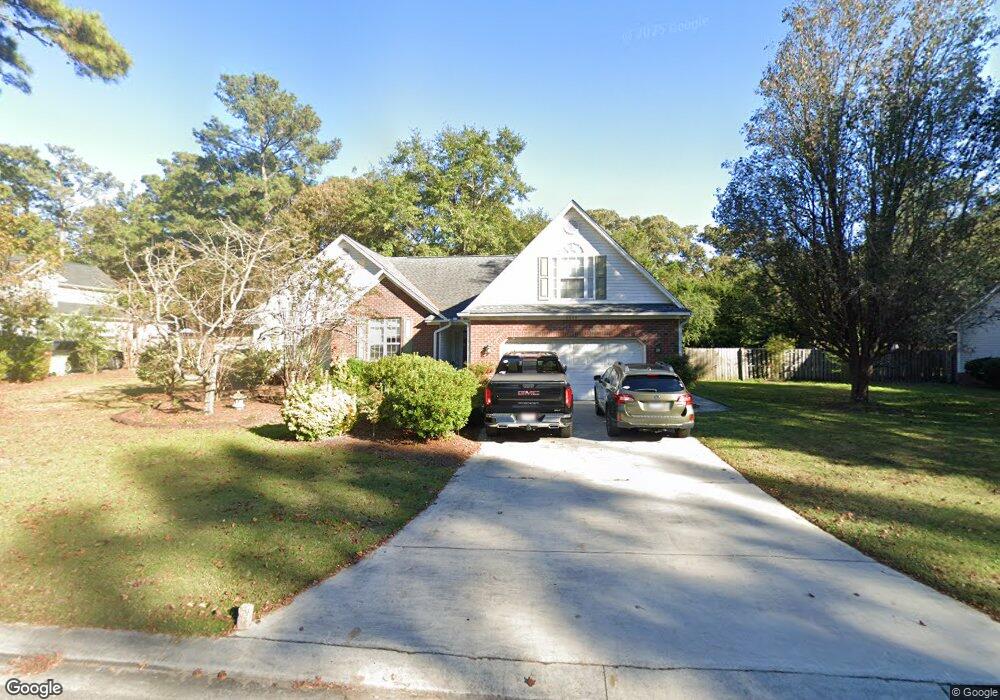
6600 Red Cedar Rd Wilmington, NC 28411
Estimated Value: $521,000 - $616,000
3
Beds
2
Baths
2,009
Sq Ft
$277/Sq Ft
Est. Value
About This Home
This home is located at 6600 Red Cedar Rd, Wilmington, NC 28411 and is currently estimated at $556,992, approximately $277 per square foot. 6600 Red Cedar Rd is a home located in New Hanover County with nearby schools including Ogden Elementary School, M.C.S. Noble Middle School, and Emsley A. Laney High School.
Ownership History
Date
Name
Owned For
Owner Type
Purchase Details
Closed on
Nov 21, 1995
Sold by
Hardison Jr Gerald Dean
Bought by
Buck Kevin M Catherine A
Current Estimated Value
Purchase Details
Closed on
Mar 6, 1995
Sold by
Landmark Developers Inc
Bought by
Hardison Gerald Dean
Purchase Details
Closed on
Mar 12, 1993
Sold by
Gps Inc
Bought by
Landmark Developers Inc
Purchase Details
Closed on
Mar 8, 1993
Sold by
Landmark Organization Inc
Bought by
Gps Inc
Purchase Details
Closed on
Dec 10, 1992
Sold by
Roebuck Company
Bought by
Landmark Organization Inc
Purchase Details
Closed on
Aug 27, 1990
Sold by
Roebuck Company
Bought by
Landmark Organization Inc
Purchase Details
Closed on
Sep 1, 1987
Sold by
Gorman Jr G C
Bought by
Roebuck Company
Create a Home Valuation Report for This Property
The Home Valuation Report is an in-depth analysis detailing your home's value as well as a comparison with similar homes in the area
Home Values in the Area
Average Home Value in this Area
Purchase History
| Date | Buyer | Sale Price | Title Company |
|---|---|---|---|
| Buck Kevin M Catherine A | $163,000 | -- | |
| Hardison Gerald Dean | $28,500 | -- | |
| Landmark Developers Inc | -- | -- | |
| Gps Inc | $6,775,000 | -- | |
| Landmark Organization Inc | -- | -- | |
| Landmark Organization Inc | $192,500 | -- | |
| Roebuck Company | -- | -- |
Source: Public Records
Tax History Compared to Growth
Tax History
| Year | Tax Paid | Tax Assessment Tax Assessment Total Assessment is a certain percentage of the fair market value that is determined by local assessors to be the total taxable value of land and additions on the property. | Land | Improvement |
|---|---|---|---|---|
| 2025 | $1,098 | $541,300 | $253,700 | $287,600 |
| 2023 | $1,005 | $356,500 | $115,000 | $241,500 |
| 2022 | $1,948 | $356,500 | $115,000 | $241,500 |
| 2021 | $1,964 | $356,500 | $115,000 | $241,500 |
| 2020 | $1,611 | $254,700 | $78,900 | $175,800 |
| 2019 | $1,611 | $254,700 | $78,900 | $175,800 |
| 2018 | $1,611 | $254,700 | $78,900 | $175,800 |
| 2017 | $1,649 | $254,700 | $78,900 | $175,800 |
| 2016 | $1,646 | $237,500 | $76,000 | $161,500 |
| 2015 | $1,530 | $237,500 | $76,000 | $161,500 |
| 2014 | $1,503 | $237,500 | $76,000 | $161,500 |
Source: Public Records
Map
Nearby Homes
- 217 Cannon Rd
- 6509 Old Fort Rd
- 233 Buff Cir
- 6420 Old Fort Rd
- 7223 Lounsberry Ct
- 7140 Arbor Oaks Dr
- 7124 Arbor Oaks Dr
- 6122 Timber Creek Ln
- 628 Middle Sound Loop Rd
- 3521 Middle Sound Loop Rd
- 106 E Brandywine Cir
- 75 Snug Harbour Dr
- 7048 Ruth Ave
- 7124 Maple Leaf Dr
- 608 Countryside Ln
- 304 Halyard Ct
- 625 Dundee Dr
- 7125 Saybrook Dr Unit LT15
- 7343 Bright Leaf Rd
- 7006 Key Point Dr
- 6604 Red Cedar Rd
- 6516 Red Cedar Rd
- 6606 Red Cedar Rd
- 6512 Red Cedar Rd
- 213 Cannon Rd
- 216 Cannon Rd Unit 23
- 6508 Red Cedar Rd
- 6607 Red Cedar Rd
- 6517 Red Cedar Rd
- 6608 Red Cedar Rd
- 209 Cannon Rd
- 6504 Red Cedar Rd
- 212 Cannon Rd
- 6513 Red Cedar Rd
- 6600 Lyonia Ct
- 205 Cannon Rd
- 6606 Lyonia Ct
- 6500 Red Cedar Rd
- 6612 Red Cedar Rd
- 208 Cannon Rd