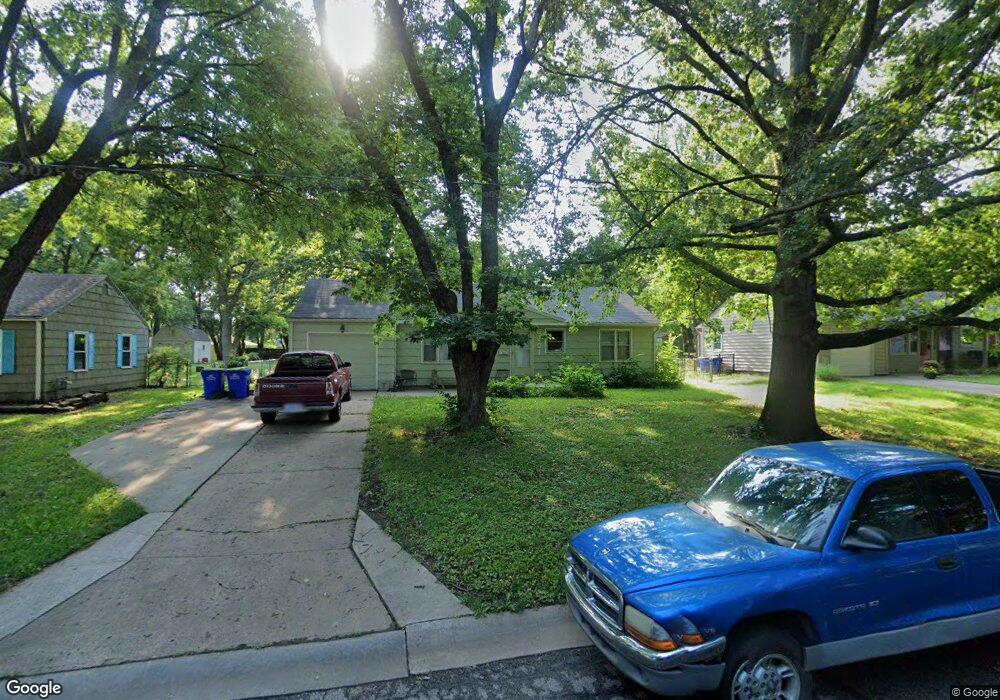
6601 Switzer Ln Shawnee, KS 66203
Estimated Value: $259,000 - $290,000
3
Beds
1
Bath
1,008
Sq Ft
$267/Sq Ft
Est. Value
About This Home
This home is located at 6601 Switzer Ln, Shawnee, KS 66203 and is currently estimated at $269,328, approximately $267 per square foot. 6601 Switzer Ln is a home located in Johnson County with nearby schools including Nieman Elementary School, Hocker Grove Middle School, and Shawnee Mission North High School.
Ownership History
Date
Name
Owned For
Owner Type
Purchase Details
Closed on
Jul 28, 2010
Sold by
Federal National Mortgage Association
Bought by
Tyrell Diana G
Current Estimated Value
Home Financials for this Owner
Home Financials are based on the most recent Mortgage that was taken out on this home.
Original Mortgage
$76,000
Outstanding Balance
$50,243
Interest Rate
4.54%
Mortgage Type
New Conventional
Estimated Equity
$219,085
Purchase Details
Closed on
Sep 10, 2008
Sold by
Ramsey Jennifer M and Stewart Jennifer M
Bought by
Ramsey Jason B
Purchase Details
Closed on
Jul 28, 2003
Sold by
Martin Thomas J and Martin Debra
Bought by
Stewart Jennifer M and Ramsey Jason B
Home Financials for this Owner
Home Financials are based on the most recent Mortgage that was taken out on this home.
Original Mortgage
$114,900
Interest Rate
5.19%
Mortgage Type
Purchase Money Mortgage
Create a Home Valuation Report for This Property
The Home Valuation Report is an in-depth analysis detailing your home's value as well as a comparison with similar homes in the area
Home Values in the Area
Average Home Value in this Area
Purchase History
| Date | Buyer | Sale Price | Title Company |
|---|---|---|---|
| Tyrell Diana G | -- | Stewart Title | |
| Ramsey Jason B | -- | Kansas City Title | |
| Stewart Jennifer M | -- | Chicago Title Insurance Comp |
Source: Public Records
Mortgage History
| Date | Status | Borrower | Loan Amount |
|---|---|---|---|
| Open | Tyrell Diana G | $76,000 | |
| Previous Owner | Stewart Jennifer M | $114,900 |
Source: Public Records
Tax History Compared to Growth
Tax History
| Year | Tax Paid | Tax Assessment Tax Assessment Total Assessment is a certain percentage of the fair market value that is determined by local assessors to be the total taxable value of land and additions on the property. | Land | Improvement |
|---|---|---|---|---|
| 2024 | $2,308 | $22,229 | $5,973 | $16,256 |
| 2023 | $2,316 | $21,700 | $5,973 | $15,727 |
| 2022 | $2,072 | $19,343 | $5,197 | $14,146 |
| 2021 | $2,061 | $17,871 | $4,516 | $13,355 |
| 2020 | $1,851 | $15,824 | $4,108 | $11,716 |
| 2019 | $1,814 | $15,491 | $3,740 | $11,751 |
| 2018 | $1,607 | $13,650 | $3,397 | $10,253 |
| 2017 | $1,517 | $12,673 | $3,397 | $9,276 |
| 2016 | $1,284 | $10,557 | $3,397 | $7,160 |
| 2015 | $1,216 | $10,557 | $3,397 | $7,160 |
| 2013 | -- | $10,798 | $3,397 | $7,401 |
Source: Public Records
Map
Nearby Homes
- 10924 W 67th St
- 6420 Ballentine St
- 10235 W 70th St
- 10024 W 70th Terrace
- 10406 W 71st Place
- 10914 W 71st St
- 11217 W 69th Terrace
- 9906 Edelweiss Cir
- 10236 Edelweiss Cir
- 10152 Edelweiss Cir
- 10902 W 71st Place
- 10314 W 73rd St
- 11637 W 68th Terrace
- 11406 W 71st St
- 7226 Edgewood Blvd
- 7240 Mastin St
- 10103 Johnson Dr
- 6901 Grandview St
- 7219 Reeder St
- 5933 Knox Ave
- 6601 Switzer St
- 6607 Switzer St
- 6545 Switzer St
- 6615 Switzer St
- 6537 Switzer St
- 6615 Switzer Ln
- 6520 Mastin St
- 6600 Mastin St
- 6516 Mastin St
- 6606 Mastin St
- 6621 Switzer St
- 6621 Switzer Ln
- 6533 Switzer Ln
- 6533 Switzer St
- 6600 Switzer St
- 6606 Switzer Ln
- 6606 Switzer St
- 6512 Mastin St
- 6612 Mastin St
- 6544 Switzer St