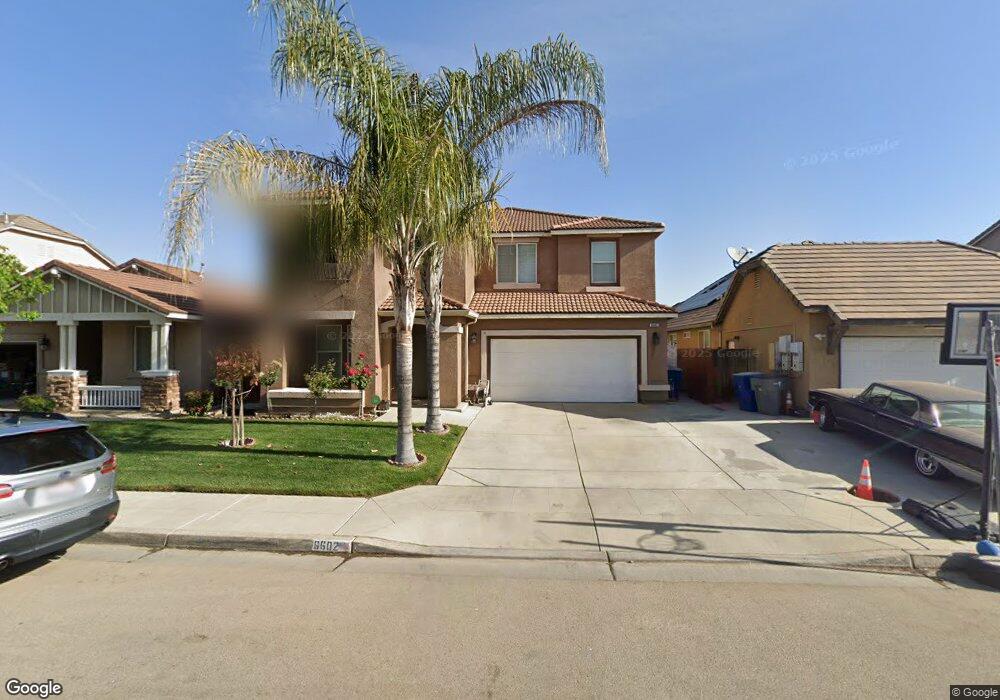
6602 E Cetti Ave Fresno, CA 93727
Sunnyside NeighborhoodEstimated Value: $497,032 - $512,000
4
Beds
3
Baths
2,567
Sq Ft
$197/Sq Ft
Est. Value
About This Home
This home is located at 6602 E Cetti Ave, Fresno, CA 93727 and is currently estimated at $505,344, approximately $196 per square foot. 6602 E Cetti Ave is a home located in Fresno County with nearby schools including John S. Wash Elementary School, Washington Academic Middle School, and Sanger High School.
Ownership History
Date
Name
Owned For
Owner Type
Purchase Details
Closed on
Apr 28, 2011
Sold by
Federal Home Loan Mortgage Corporation
Bought by
Grewal Harinder and Grewal Karamjit
Current Estimated Value
Home Financials for this Owner
Home Financials are based on the most recent Mortgage that was taken out on this home.
Original Mortgage
$185,183
Outstanding Balance
$11,299
Interest Rate
4.72%
Mortgage Type
FHA
Estimated Equity
$494,045
Purchase Details
Closed on
Oct 27, 2010
Sold by
Keovilai Alex and Keovilai Maniphet
Bought by
Federal Home Loan Mortgage Corporation
Purchase Details
Closed on
Sep 21, 2007
Sold by
Martin Joseph W
Bought by
Martin Sarah A
Purchase Details
Closed on
Jun 8, 2007
Sold by
D R Horton Inc
Bought by
Keovilai Alex and Keovilai Maniphet
Home Financials for this Owner
Home Financials are based on the most recent Mortgage that was taken out on this home.
Original Mortgage
$318,160
Interest Rate
6.14%
Mortgage Type
Purchase Money Mortgage
Create a Home Valuation Report for This Property
The Home Valuation Report is an in-depth analysis detailing your home's value as well as a comparison with similar homes in the area
Home Values in the Area
Average Home Value in this Area
Purchase History
| Date | Buyer | Sale Price | Title Company |
|---|---|---|---|
| Grewal Harinder | $190,000 | First American Title Ins Co | |
| Federal Home Loan Mortgage Corporation | $181,315 | None Available | |
| Martin Sarah A | -- | First American Title Company | |
| Keovilai Alex | $328,000 | First American Title Company |
Source: Public Records
Mortgage History
| Date | Status | Borrower | Loan Amount |
|---|---|---|---|
| Open | Grewal Harinder | $185,183 | |
| Previous Owner | Keovilai Alex | $318,160 |
Source: Public Records
Tax History
| Year | Tax Paid | Tax Assessment Tax Assessment Total Assessment is a certain percentage of the fair market value that is determined by local assessors to be the total taxable value of land and additions on the property. | Land | Improvement |
|---|---|---|---|---|
| 2025 | $3,808 | $243,413 | $57,648 | $185,765 |
| 2023 | $3,159 | $233,962 | $55,410 | $178,552 |
| 2022 | $3,090 | $229,375 | $54,324 | $175,051 |
| 2021 | $3,058 | $224,878 | $53,259 | $171,619 |
| 2020 | $2,966 | $222,573 | $52,713 | $169,860 |
| 2019 | $2,892 | $218,210 | $51,680 | $166,530 |
| 2018 | $2,790 | $213,932 | $50,667 | $163,265 |
| 2017 | $2,711 | $209,738 | $49,674 | $160,064 |
| 2016 | $2,592 | $205,626 | $48,700 | $156,926 |
| 2015 | $2,679 | $202,538 | $47,969 | $154,569 |
| 2014 | $2,666 | $198,572 | $47,030 | $151,542 |
Source: Public Records
Map
Nearby Homes
- 6954 E Braly Ave
- 6349 E Braly Ave
- 6310 E Woodward Ave
- 944 S Clover Ave
- 6591 E Liberty Ave
- 6525 E Raco Ave
- 7176 E Butler Ave
- 284 S Temperance Ave
- 6035 E Lyell Ave
- 5912 E Hamilton Ave
- 1581 S Temperance Ave
- 5986 E Pitt Ave
- 5903 E Butler Ave
- 5867 E Club View Dr
- 1695 S Temperance Ave
- 5875 E Pitt Ave
- 5823 E Pitt Ave
- 833 S Stanford Ave
- 2481 S Via Versilia Dr
- 1817 S Temperance Ave
- 6610 E Cetti Ave
- 6594 E Cetti Ave
- 6618 E Cetti Ave
- 6586 E Cetti Ave
- 6626 E Cetti Ave
- 6578 E Cetti Ave
- 6599 E Cetti Ave
- 6607 E Cetti Ave
- 6591 E Cetti Ave
- 6583 E Cetti Ave
- 6634 E Cetti Ave
- 6570 E Cetti Ave
- 6623 E Cetti Ave
- 6642 E Cetti Ave
- 6562 E Cetti Ave
- 6631 E Cetti Ave
- 6567 E Cetti Ave
- 6602 E Braly Ave
- 6619 E Harwood Ave
- 6610 E Braly Ave Unit Lot66
Your Personal Tour Guide
Ask me questions while you tour the home.