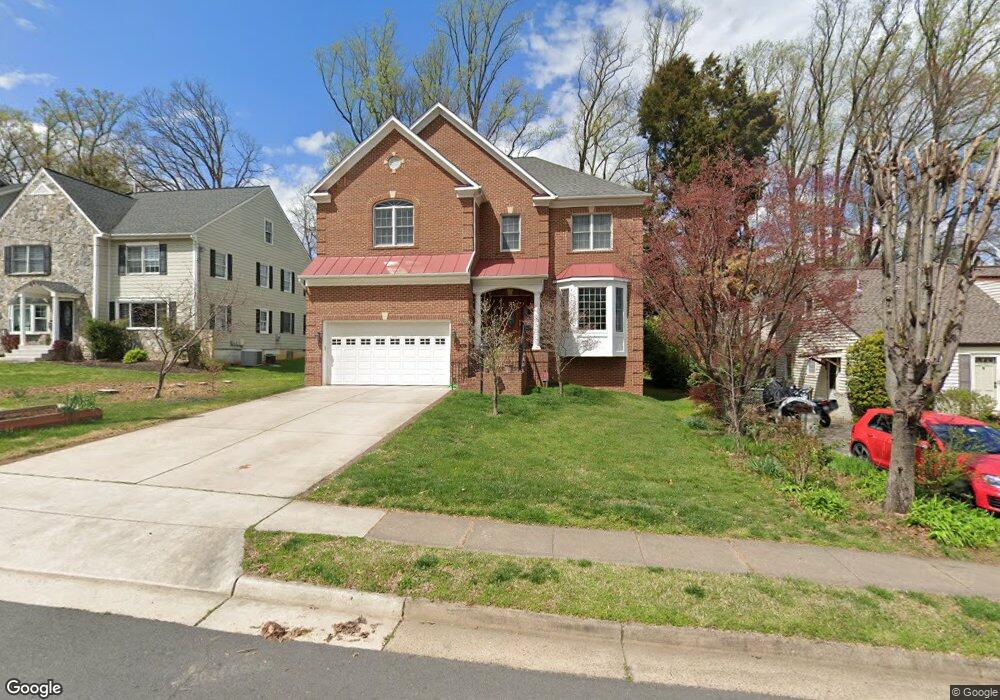
6602 Orland St Falls Church, VA 22043
Estimated Value: $1,606,858 - $1,994,000
4
Beds
5
Baths
3,416
Sq Ft
$534/Sq Ft
Est. Value
About This Home
This home is located at 6602 Orland St, Falls Church, VA 22043 and is currently estimated at $1,823,715, approximately $533 per square foot. 6602 Orland St is a home located in Fairfax County with nearby schools including Haycock Elementary School, Longfellow Middle School, and St. James Catholic School.
Ownership History
Date
Name
Owned For
Owner Type
Purchase Details
Closed on
May 16, 2018
Sold by
Musser Jonathan and Musser Nancy
Bought by
Musser Jonathan T and Musser Nancy A
Current Estimated Value
Purchase Details
Closed on
Mar 24, 2006
Sold by
Orland 6602
Bought by
Cheng Mike D
Purchase Details
Closed on
Dec 15, 2004
Sold by
Dunlap Julia R
Bought by
6602 Orland Llc
Home Financials for this Owner
Home Financials are based on the most recent Mortgage that was taken out on this home.
Original Mortgage
$491,650
Interest Rate
5.68%
Mortgage Type
New Conventional
Purchase Details
Closed on
Jan 7, 2004
Sold by
Wanda Hudson Exec Of The
Bought by
Dunlap Julia
Create a Home Valuation Report for This Property
The Home Valuation Report is an in-depth analysis detailing your home's value as well as a comparison with similar homes in the area
Home Values in the Area
Average Home Value in this Area
Purchase History
| Date | Buyer | Sale Price | Title Company |
|---|---|---|---|
| Musser Jonathan T | -- | None Available | |
| Cheng Mike D | $505,000 | -- | |
| 6602 Orland Llc | $424,165 | -- | |
| Dunlap Julia | $350,000 | -- |
Source: Public Records
Mortgage History
| Date | Status | Borrower | Loan Amount |
|---|---|---|---|
| Previous Owner | 6602 Orland Llc | $491,650 |
Source: Public Records
Tax History Compared to Growth
Tax History
| Year | Tax Paid | Tax Assessment Tax Assessment Total Assessment is a certain percentage of the fair market value that is determined by local assessors to be the total taxable value of land and additions on the property. | Land | Improvement |
|---|---|---|---|---|
| 2025 | $17,262 | $1,453,340 | $540,000 | $913,340 |
| 2024 | $17,262 | $1,414,040 | $540,000 | $874,040 |
| 2023 | $15,478 | $1,301,590 | $500,000 | $801,590 |
| 2022 | $14,741 | $1,222,940 | $441,000 | $781,940 |
| 2021 | $13,682 | $1,143,510 | $441,000 | $702,510 |
| 2020 | $13,385 | $1,109,420 | $432,000 | $677,420 |
| 2019 | $13,117 | $1,087,220 | $432,000 | $655,220 |
| 2018 | $11,881 | $1,033,130 | $415,000 | $618,130 |
| 2017 | $12,165 | $1,027,490 | $413,000 | $614,490 |
| 2016 | $12,068 | $1,021,410 | $413,000 | $608,410 |
| 2015 | $11,140 | $978,010 | $393,000 | $585,010 |
| 2014 | $10,760 | $946,740 | $385,000 | $561,740 |
Source: Public Records
Map
Nearby Homes
- 6610 Quinten St
- 6609 Rockmont Ct
- 2125 Hilltop Place
- 6616 Kirby Ct
- 6607 Midhill Place
- 2221 Orchid Dr
- 6449 Orland St
- 6616 Fisher Ave
- 6620 Rosecroft Place
- 6613 Fisher Ave
- 2005 Highboro Way
- 6601 Gordon Ave
- 2115 Natahoa Ct
- 2231 N Tuckahoe St
- 2123 Natahoa Ct
- 2300 Meridian St
- 6712 Moly Dr
- 2302 Westmoreland St
- 6602 Jerry Place
- 2136 Powhatan St