


6607 Melrose Ln Shawnee, KS 66203
Estimated payment $2,081/month
Highlights
- Ranch Style House
- Converted Garage
- Living Room
- No HOA
- 2 Car Detached Garage
- Laundry Room
About This Home
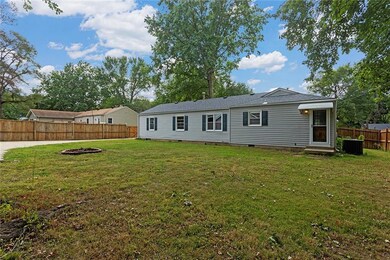
Beautifully updated 4 bed, 3 bath home located in the heart of Shawnee, close to major highways, restaurants, and shopping. Enjoy easy one-level living with spacious bedrooms and an open layout. Home features newer roof and HVAC system, oversized fenced backyard, and a 29' x 33' shop with electricity and water. Shop includes separate driveway access and an 11.5' x 32' lean-to for extra covered storage. Ideal for hobbies, business use, or additional storage. Don’t miss this rare opportunity for versatile space in a prime location!
Listing Agent
United Real Estate Kansas City Brokerage Phone: 913-742-2662 License #SP00241136 Listed on: 09/06/2025

Home Details
Home Type
- Single Family
Est. Annual Taxes
- $2,955
Year Built
- Built in 1953
Lot Details
- 0.36 Acre Lot
Parking
- 2 Car Detached Garage
- Converted Garage
Home Design
- Ranch Style House
- Composition Roof
- Vinyl Siding
Interior Spaces
- 1,560 Sq Ft Home
- Living Room
- Dining Room
- Crawl Space
- Attic Fan
- Laundry Room
Bedrooms and Bathrooms
- 4 Bedrooms
Utilities
- Central Air
- Heating System Uses Natural Gas
Community Details
- No Home Owners Association
- Douglas Highland Subdivision
Listing and Financial Details
- Assessor Parcel Number QP16800008-0022
- $0 special tax assessment
Map
Home Values in the Area
Average Home Value in this Area
Tax History
| Year | Tax Paid | Tax Assessment Tax Assessment Total Assessment is a certain percentage of the fair market value that is determined by local assessors to be the total taxable value of land and additions on the property. | Land | Improvement |
|---|---|---|---|---|
| 2024 | $2,956 | $28,210 | $6,094 | $22,116 |
| 2023 | $2,972 | $27,784 | $6,094 | $21,690 |
| 2022 | $2,468 | $23,000 | $5,303 | $17,697 |
| 2021 | $2,694 | $23,437 | $4,608 | $18,829 |
| 2020 | $2,678 | $22,989 | $4,192 | $18,797 |
| 2019 | $2,500 | $21,436 | $3,817 | $17,619 |
| 2018 | $1,968 | $18,906 | $3,467 | $15,439 |
| 2017 | $2,159 | $18,135 | $3,467 | $14,668 |
| 2016 | $1,802 | $14,904 | $3,467 | $11,437 |
| 2015 | $1,721 | $14,904 | $3,467 | $11,437 |
| 2013 | -- | $14,490 | $3,467 | $11,023 |
Property History
| Date | Event | Price | List to Sale | Price per Sq Ft |
|---|---|---|---|---|
| 09/06/2025 09/06/25 | For Sale | $349,950 | -- | $224 / Sq Ft |
Purchase History
| Date | Type | Sale Price | Title Company |
|---|---|---|---|
| Interfamily Deed Transfer | -- | Security 1St Title Llc | |
| Warranty Deed | -- | Security 1St Title Llc | |
| Warranty Deed | -- | Chicago Title | |
| Trustee Deed | -- | Chicago Title | |
| Warranty Deed | -- | None Available |
Mortgage History
| Date | Status | Loan Amount | Loan Type |
|---|---|---|---|
| Open | $190,000 | New Conventional |
Source: Heartland MLS
MLS Number: 2574006
APN: QP16800008-0022
Disclaimer: Certain information contained herein is derived from information provided by parties other than Homes.com. All information provided is deemed reliable, but is not guaranteed to be accurate and should be independently verified.
![]() Based on information submitted to the MLS GRID as of [see last changed date above]. All data is obtained from various sources and may not have been verified by broker or MLS GRID. Supplied Open House Information is subject to change without notice. All information should be independently reviewed and verified for accuracy. Properties may or may not be listed by the office/agent presenting the information. Some IDX listings have been excluded from this website. Prices displayed on all Sold listings are the Last Known Listing Price and may not be the actual selling price.
Based on information submitted to the MLS GRID as of [see last changed date above]. All data is obtained from various sources and may not have been verified by broker or MLS GRID. Supplied Open House Information is subject to change without notice. All information should be independently reviewed and verified for accuracy. Properties may or may not be listed by the office/agent presenting the information. Some IDX listings have been excluded from this website. Prices displayed on all Sold listings are the Last Known Listing Price and may not be the actual selling price.
Listing Information presented by local MLS brokerage: TEN-X, INC., local REALTOR®- Arlene Richardson - (888)952-6393
The Digital Millennium Copyright Act of 1998, 17 U.S.C. § 512 (the “DMCA”) provides recourse for copyright owners who believe that material appearing on the Internet infringes their rights under U.S. copyright law. If you believe in good faith that any content or material made available in connection with our website or services infringes your copyright, you (or your agent) may send us a notice requesting that the content or material be removed, or access to it blocked.
Notices must be sent in writing by email to DMCAnotice@MLSGrid.com.
The DMCA requires that your notice of alleged copyright infringement include the following information:
(1) description of the copyrighted work that is the subject of claimed infringement;
(2) description of the alleged infringing content and information sufficient to permit us to locate the content;
(3) contact information for you, including your address, telephone number and email address;
(4) a statement by you that you have a good faith belief that the content in the manner complained of is not authorized by the copyright owner, or its agent, or by the operation of any law;
(5) a statement by you, signed under penalty of perjury, that the information in the notification is accurate and that you have the authority to enforce the copyrights that are claimed to be infringed; and
(6) a physical or electronic signature of the copyright owner or a person authorized to act on the copyright owner’s behalf. Failure to include all of the above information may result in the delay of the processing of your complaint.
- 6643 Ballentine St
- 6515 Switzer Ln
- 10703 W 67th St
- 10924 W 67th St
- 6417 Larsen Ln
- 6319 Sherwood Ln
- 10914 W 71st St
- 11401 W 68th Terrace
- 10406 W 71st Place
- 9902 Edelweiss Cir
- 7102 Mastin St
- 9906 Edelweiss Cir
- 10902 W 71st Place
- 10152 Edelweiss Cir
- 11406 W 71st St
- 10414 W 73rd St
- 7226 Edgewood Blvd
- 7219 Reeder St
- 6018 Knox Ave
- 7240 Mastin St
- 10405 W 70th Terrace
- 10302 W 62nd St
- 6016 Roger Rd
- 7130 King St
- 6451 E Frontage Rd
- 7200 Eby Ave
- 6009 King St
- 9002 W 64th Terrace
- 7350 Kings Cove Dr
- 8707 Shawnee Mission Pkwy
- 7325 Quivira Rd
- 7650 Goddard St
- 7530 Cody St
- 7819 Carter Dr
- 11212 Lecluyse Dr
- 7620 Halsey St
- 10020 W 80th St
- 8015 Lenexa Dr
- 5710 Hadley St
- 9213 W 79th St