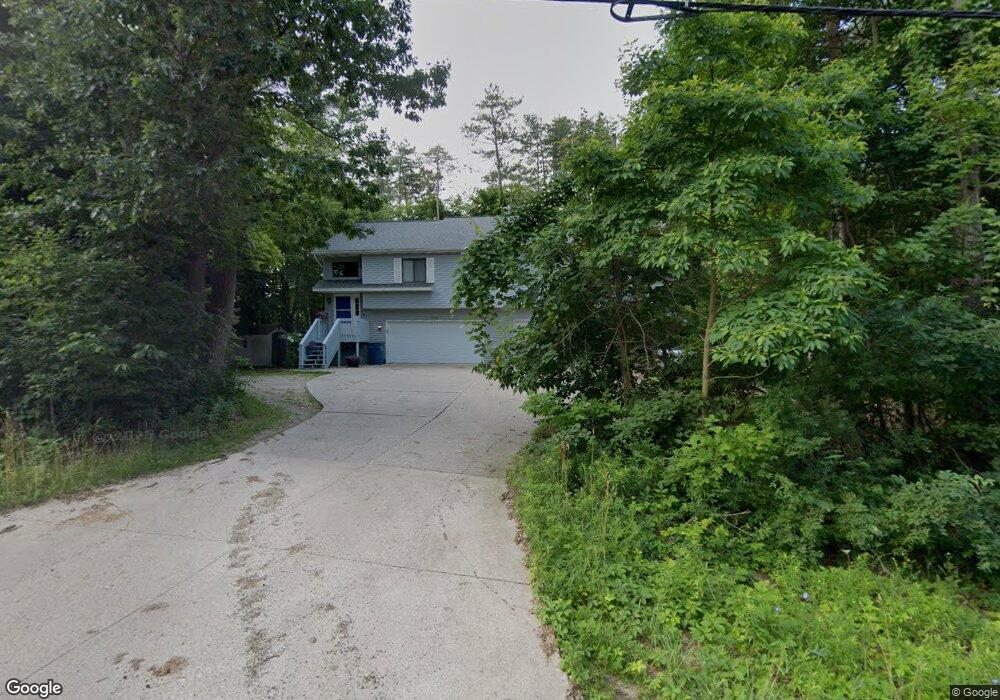
6608 North St Saugatuck, MI 49453
Estimated Value: $701,077 - $927,000
--
Bed
4
Baths
4,980
Sq Ft
$163/Sq Ft
Est. Value
About This Home
This home is located at 6608 North St, Saugatuck, MI 49453 and is currently estimated at $812,769, approximately $163 per square foot. 6608 North St is a home located in Allegan County with nearby schools including Douglas Elementary School, Saugatuck Middle School, and Saugatuck High School.
Ownership History
Date
Name
Owned For
Owner Type
Purchase Details
Closed on
Jul 22, 2013
Sold by
Tedaldi Alfred P and Tedaldi Shirley A
Bought by
Tedaldi Sherry L
Current Estimated Value
Home Financials for this Owner
Home Financials are based on the most recent Mortgage that was taken out on this home.
Original Mortgage
$173,600
Outstanding Balance
$126,765
Interest Rate
4.02%
Mortgage Type
New Conventional
Estimated Equity
$686,004
Purchase Details
Closed on
Feb 9, 2007
Sold by
Tedaldi Sherry L
Bought by
Tedaldi Alfred P and Tedaldi Shirley A
Home Financials for this Owner
Home Financials are based on the most recent Mortgage that was taken out on this home.
Original Mortgage
$196,000
Interest Rate
6.27%
Mortgage Type
Balloon
Purchase Details
Closed on
Nov 4, 1998
Sold by
Teddaldi Dino C and Teddaldi Jeanne A
Bought by
Tedaldi Sherry
Purchase Details
Closed on
Oct 28, 1997
Bought by
Teddaldi Dino C and Teddaldi Jeanne A
Create a Home Valuation Report for This Property
The Home Valuation Report is an in-depth analysis detailing your home's value as well as a comparison with similar homes in the area
Home Values in the Area
Average Home Value in this Area
Purchase History
| Date | Buyer | Sale Price | Title Company |
|---|---|---|---|
| Tedaldi Sherry L | $217,000 | Safe Title Inc | |
| Tedaldi Alfred P | $245,000 | None Available | |
| Tedaldi Sherry | -- | -- | |
| Teddaldi Dino C | -- | -- |
Source: Public Records
Mortgage History
| Date | Status | Borrower | Loan Amount |
|---|---|---|---|
| Open | Tedaldi Sherry L | $173,600 | |
| Previous Owner | Tedaldi Alfred P | $196,000 | |
| Previous Owner | Tedaldi Alfred P | $20,000 |
Source: Public Records
Tax History Compared to Growth
Tax History
| Year | Tax Paid | Tax Assessment Tax Assessment Total Assessment is a certain percentage of the fair market value that is determined by local assessors to be the total taxable value of land and additions on the property. | Land | Improvement |
|---|---|---|---|---|
| 2025 | $9,583 | $337,500 | $80,300 | $257,200 |
| 2024 | -- | $297,600 | $75,600 | $222,000 |
| 2023 | -- | $267,300 | $71,200 | $196,100 |
| 2022 | $0 | $431,300 | $74,700 | $356,600 |
| 2021 | $7,417 | $227,300 | $74,700 | $152,600 |
| 2020 | $7,417 | $227,200 | $74,700 | $152,500 |
| 2019 | $0 | $183,000 | $47,500 | $135,500 |
| 2018 | $0 | $157,300 | $47,500 | $109,800 |
| 2017 | $0 | $159,600 | $47,500 | $112,100 |
| 2016 | $0 | $159,400 | $47,500 | $111,900 |
| 2015 | -- | $159,400 | $47,500 | $111,900 |
| 2014 | -- | $137,500 | $0 | $0 |
| 2013 | -- | $120,300 | $47,500 | $72,800 |
Source: Public Records
Map
Nearby Homes
- 6593 134th Ave
- 251 North St
- 6440 Gaslight Ln
- N of 3365 Clearview Ln
- 3351 Gaslight Ln
- 3341 Gaslight Ln
- 212 N Maple St
- 417 Spear St
- 0 Sugar Hill Ct Unit 3 22025060
- 149 Taylor St
- 873 Park St
- Lot 2 Blue Star Hwy
- Lot Jack Wilson Rd
- 660 Lake St
- 678 Lake St
- 445 S Maple St
- VL Lake St
- 790 Lake St
- VL Park St
- 64 Griffith St Unit 17
- 3394 Blue Star Hwy
- 6612 North St
- 3401 Blue Star Hwy Unit 20
- 3401 Blue Star Hwy Unit 10
- 3401 Blue Star Hwy
- 3390 Blue Star Hwy Unit 3388
- 0 134th Ave Unit 71023020628
- 0 134th Ave Unit 23020628
- 0 134th Ave Unit 71016038112
- 0 134th Ave Unit 71015061870
- 0 134th Ave Unit 71014060637
- 0 134th Ave Unit 71013035634
- 0 134th Ave Unit 71019026059
- 0 134th Ave Unit 71017014366
- 0 134th Ave Unit 71018013077
- 0 134th Ave Unit 71013049797
- 0 134th Ave Unit 71019012376
- 0 134th Ave Unit 71017037732
- 0 134th Ave Unit M13049797
- V/L C 134th Ave