Estimated Value: $293,000 - $329,000
3
Beds
3
Baths
1,675
Sq Ft
$187/Sq Ft
Est. Value
About This Home
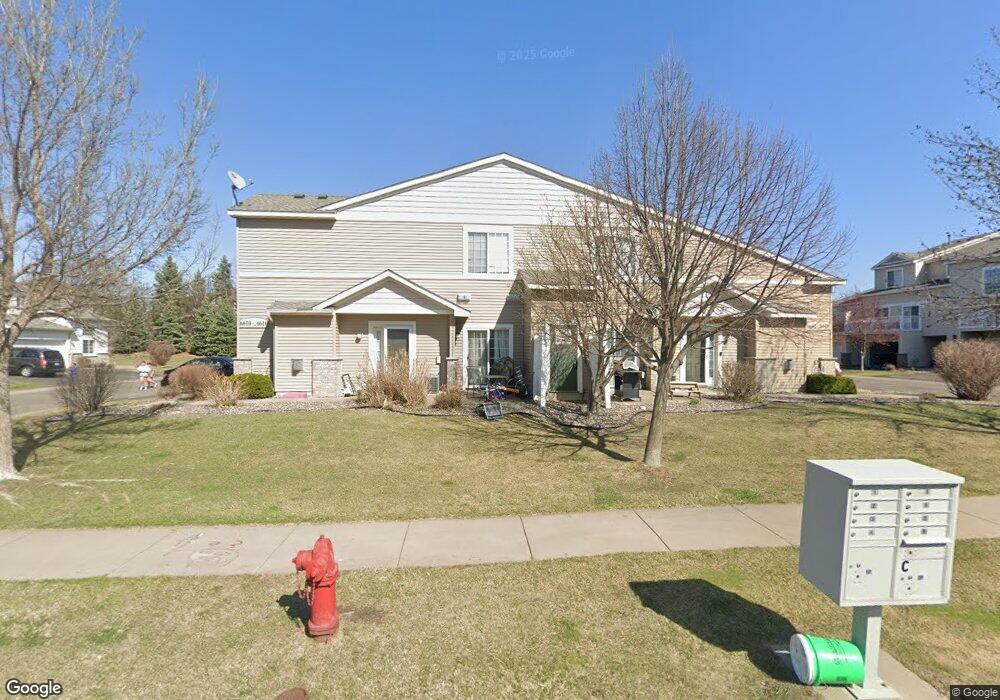
This home is located at 6608 Olive Ln N, Osseo, MN 55311 and is currently estimated at $313,380, approximately $187 per square foot. 6608 Olive Ln N is a home located in Hennepin County with nearby schools including Basswood Elementary School, Maple Grove Middle School, and Maple Grove Senior High School.
Ownership History
Date
Name
Owned For
Owner Type
Purchase Details
Closed on
May 13, 2021
Sold by
Uppal Vijay K and Uppal Shobha N
Bought by
Adenodi Sylvester Rotimi
Current Estimated Value
Home Financials for this Owner
Home Financials are based on the most recent Mortgage that was taken out on this home.
Original Mortgage
$15,000
Outstanding Balance
$13,560
Interest Rate
2.94%
Mortgage Type
New Conventional
Estimated Equity
$299,820
Create a Home Valuation Report for This Property
The Home Valuation Report is an in-depth analysis detailing your home's value as well as a comparison with similar homes in the area
Home Values in the Area
Average Home Value in this Area
Purchase History
| Date | Buyer | Sale Price | Title Company |
|---|---|---|---|
| Adenodi Sylvester Rotimi | $276,000 | West Title Llc | |
| Adenodi Sylvester Sylvester | $276,000 | -- |
Source: Public Records
Mortgage History
| Date | Status | Borrower | Loan Amount |
|---|---|---|---|
| Open | Adenodi Sylvester Rotimi | $15,000 | |
| Open | Adenodi Sylvester Rotimi | $267,720 | |
| Closed | Adenodi Sylvester Sylvester | $276,000 |
Source: Public Records
Tax History Compared to Growth
Tax History
| Year | Tax Paid | Tax Assessment Tax Assessment Total Assessment is a certain percentage of the fair market value that is determined by local assessors to be the total taxable value of land and additions on the property. | Land | Improvement |
|---|---|---|---|---|
| 2024 | $3,390 | $294,800 | $73,700 | $221,100 |
| 2023 | $3,450 | $302,100 | $81,700 | $220,400 |
| 2022 | $2,965 | $306,900 | $74,600 | $232,300 |
| 2021 | $3,018 | $256,000 | $52,400 | $203,600 |
| 2020 | $2,896 | $244,500 | $48,200 | $196,300 |
| 2019 | $2,873 | $222,800 | $40,700 | $182,100 |
| 2018 | $2,736 | $208,600 | $40,200 | $168,400 |
| 2017 | $2,692 | $183,800 | $40,500 | $143,300 |
| 2016 | $2,548 | $171,500 | $35,000 | $136,500 |
| 2015 | $2,541 | $166,400 | $36,000 | $130,400 |
| 2014 | -- | $148,000 | $32,000 | $116,000 |
Source: Public Records
Map
Nearby Homes
- 17812 66th Ave N
- 6566 Merrimac Ln N
- 6647 Peony Ln N
- 17716 Elm Rd N
- 6508 Merrimac Ln N Unit 6508
- 6473 Merrimac Ln N
- 6860 Peony Ln N
- 17673 69th Place N
- 17987 69th Place N Unit 1105
- 6848 Troy Ln N
- 6757 Urbandale Ln N
- 6300 Ranier Ln N
- 17549 70th Place N
- 6287 Fountain Ln N
- 6324 Fountain Ln N
- 6540 Yellowstone Ln N
- 17749 62nd Ave N
- 6205 Ranier Ln N
- 17344 72nd Ave N Unit 1304
- 7201 Jewel Ln N Unit 907
- 6616 Olive Ln N
- 6602 Olive Ln N
- 6614 Olive Ln N
- 6612 Olive Ln N
- 6610 Olive Ln N
- 6606 Olive Ln N
- 6604 Olive Ln N
- 6600 Olive Ln N
- 6598 Olive Ln N
- 6594 Olive Ln N
- 6590 Olive Ln N
- 6588 Olive Ln N
- 6586 Olive Ln N
- 6624 Olive Ln N
- 6626 Olive Ln N
- 6618 Olive Ln N
- 6628 Olive Ln N
- 6622 Olive Ln N
- 6620 Olive Ln N
- 6596 Olive Ln N