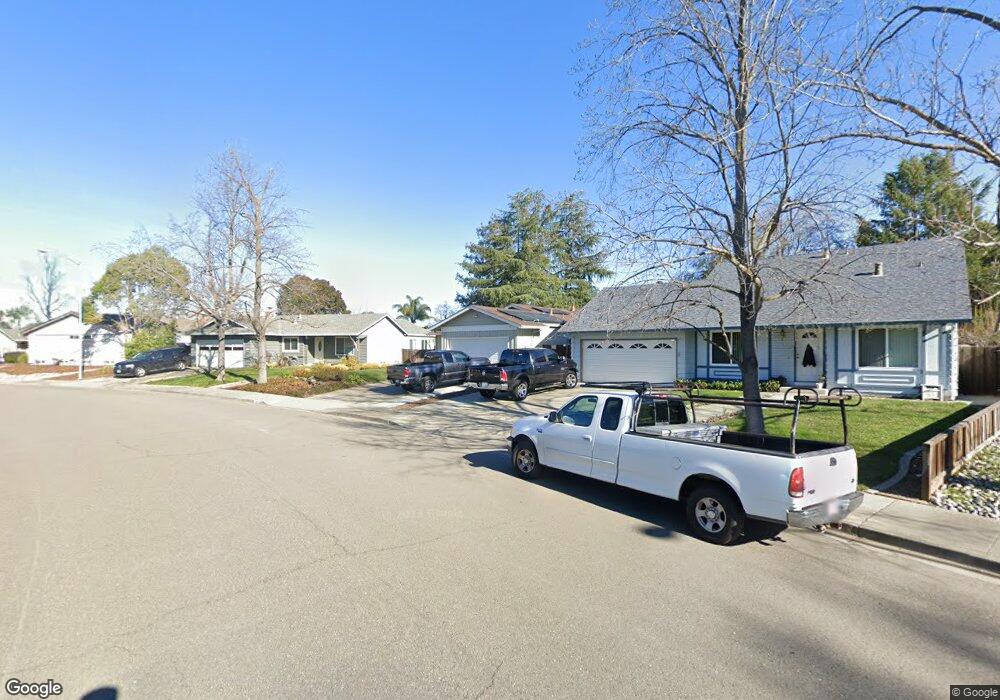
661 Covington Way Livermore, CA 94551
Summerset NeighborhoodEstimated Value: $1,103,700 - $1,234,000
3
Beds
2
Baths
1,366
Sq Ft
$845/Sq Ft
Est. Value
About This Home
This home is located at 661 Covington Way, Livermore, CA 94551 and is currently estimated at $1,154,425, approximately $845 per square foot. 661 Covington Way is a home located in Alameda County with nearby schools including Rancho Las Positas Elementary School, Junction Avenue K-8 School, and Granada High School.
Ownership History
Date
Name
Owned For
Owner Type
Purchase Details
Closed on
Mar 13, 2020
Sold by
Carbino Jeannine L and Carbino John J
Bought by
Carbino Jeannine L and Carbino John J
Current Estimated Value
Purchase Details
Closed on
Sep 19, 2011
Sold by
Barnes Richard G and Barnes Nancy J
Bought by
Carbino John J and Carbino Jeannine L
Home Financials for this Owner
Home Financials are based on the most recent Mortgage that was taken out on this home.
Original Mortgage
$296,000
Outstanding Balance
$202,699
Interest Rate
4.26%
Mortgage Type
New Conventional
Estimated Equity
$951,726
Purchase Details
Closed on
Apr 27, 1998
Sold by
Barnes Richard G and Barnes Nancy J
Bought by
Barnes Richard G and Barnes Nancy J
Home Financials for this Owner
Home Financials are based on the most recent Mortgage that was taken out on this home.
Original Mortgage
$126,750
Interest Rate
7.05%
Purchase Details
Closed on
Nov 9, 1994
Sold by
Barnes Richard G and Barnes Nancy J
Bought by
Barnes Richard G and Barnes Nancy J
Create a Home Valuation Report for This Property
The Home Valuation Report is an in-depth analysis detailing your home's value as well as a comparison with similar homes in the area
Home Values in the Area
Average Home Value in this Area
Purchase History
| Date | Buyer | Sale Price | Title Company |
|---|---|---|---|
| Carbino Jeannine L | -- | None Available | |
| Carbino John J | $370,000 | Chicago Title Company | |
| Barnes Richard G | -- | Financial Title Company | |
| Barnes Richard G | -- | -- |
Source: Public Records
Mortgage History
| Date | Status | Borrower | Loan Amount |
|---|---|---|---|
| Open | Carbino John J | $296,000 | |
| Previous Owner | Barnes Richard G | $126,750 |
Source: Public Records
Tax History Compared to Growth
Tax History
| Year | Tax Paid | Tax Assessment Tax Assessment Total Assessment is a certain percentage of the fair market value that is determined by local assessors to be the total taxable value of land and additions on the property. | Land | Improvement |
|---|---|---|---|---|
| 2025 | $6,239 | $457,715 | $139,414 | $325,301 |
| 2024 | $6,239 | $448,606 | $136,682 | $318,924 |
| 2023 | $6,136 | $446,674 | $134,002 | $312,672 |
| 2022 | $6,038 | $430,917 | $131,375 | $306,542 |
| 2021 | $5,909 | $422,332 | $128,799 | $300,533 |
| 2020 | $5,729 | $424,933 | $127,480 | $297,453 |
| 2019 | $5,745 | $416,604 | $124,981 | $291,623 |
| 2018 | $5,614 | $408,438 | $122,531 | $285,907 |
| 2017 | $5,463 | $400,431 | $120,129 | $280,302 |
| 2016 | $5,251 | $392,580 | $117,774 | $274,806 |
| 2015 | $4,932 | $386,686 | $116,006 | $270,680 |
| 2014 | $4,843 | $379,112 | $113,733 | $265,379 |
Source: Public Records
Map
Nearby Homes
- 1567 Wilton Rd
- 866 Cortland Way
- 651 Brookfield Dr
- 1059 Lakehurst Rd
- 646 Brighton Way
- 848 Del Norte Dr
- 1727 Sutter St
- 635 Zermatt St
- 1186 Via Cristobal Unit 110
- 1382 Vía Deste Unit 61
- 1033 Plumas Ct
- 761 Pine St
- 727 Sandpiper Common
- 303 Garden Common
- 847 Crane Ave
- 897 Tranquility Cir Unit 12
- 833 Tranquility Cir Unit 5
- Plan 2 at Parkview
- Plan 1 at Parkview
- 783 Falcon Way
- 657 Covington Way
- 679 Covington Way
- 640 Huntington Way
- 634 Huntington Way
- 597 Covington Way
- 672 Huntington Way
- 886 Hanover St
- 626 Huntington Way
- 874 Hanover St
- 588 Covington Way
- 686 Huntington Way
- 862 Hanover St
- 583 Covington Way
- 590 Covington Way
- 570 Huntington Way
- 576 Covington Way
- 854 Hanover St
- 558 Huntington Way
- 571 Covington Way
- 619 Bethal Place