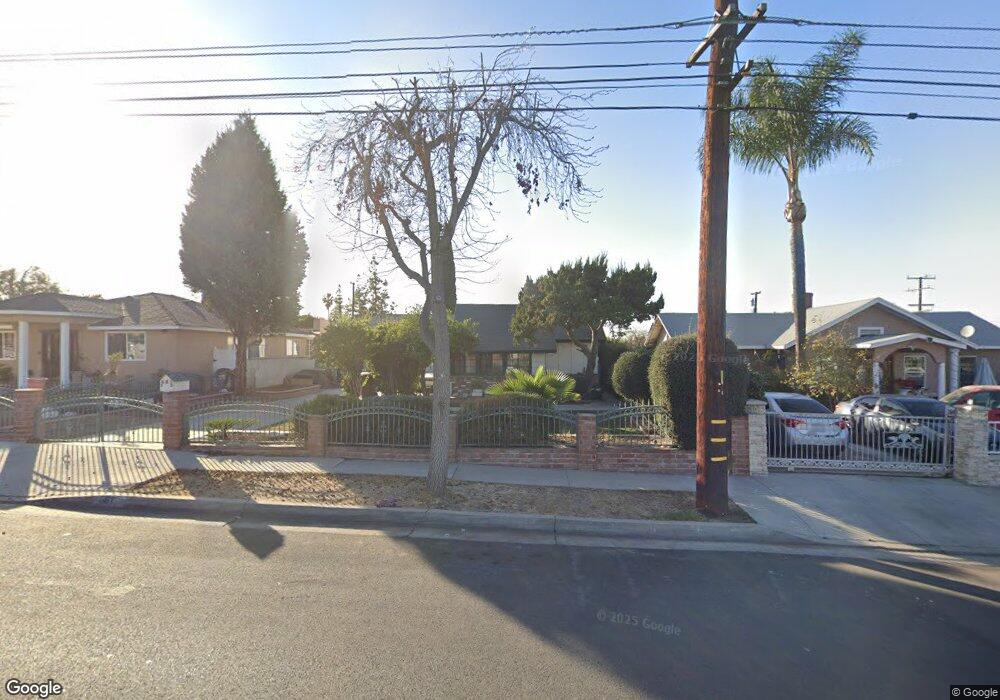
661 Del Valle Ave La Puente, CA 91744
Estimated Value: $770,000 - $842,000
3
Beds
2
Baths
1,550
Sq Ft
$512/Sq Ft
Est. Value
About This Home
This home is located at 661 Del Valle Ave, La Puente, CA 91744 and is currently estimated at $793,367, approximately $511 per square foot. 661 Del Valle Ave is a home located in Los Angeles County with nearby schools including Del Valle Elementary School, Sierra Vista Middle School, and La Puente High School.
Ownership History
Date
Name
Owned For
Owner Type
Purchase Details
Closed on
Aug 29, 2003
Sold by
Polanco Virginia
Bought by
Polanco David O
Current Estimated Value
Home Financials for this Owner
Home Financials are based on the most recent Mortgage that was taken out on this home.
Original Mortgage
$170,000
Outstanding Balance
$77,232
Interest Rate
5.94%
Mortgage Type
Purchase Money Mortgage
Estimated Equity
$716,135
Purchase Details
Closed on
Jan 24, 1997
Sold by
Polanco David O
Bought by
Polanco David O and Polanco Virginia
Purchase Details
Closed on
May 2, 1994
Sold by
Coast Federal Bank Fsb
Bought by
Polanco David O
Home Financials for this Owner
Home Financials are based on the most recent Mortgage that was taken out on this home.
Original Mortgage
$125,100
Interest Rate
4.95%
Purchase Details
Closed on
Dec 10, 1993
Sold by
Coast Fed Services
Bought by
Coast Federal Bank Fsb
Create a Home Valuation Report for This Property
The Home Valuation Report is an in-depth analysis detailing your home's value as well as a comparison with similar homes in the area
Home Values in the Area
Average Home Value in this Area
Purchase History
| Date | Buyer | Sale Price | Title Company |
|---|---|---|---|
| Polanco David O | -- | First American Title Co | |
| Polanco David O | -- | -- | |
| Polanco David O | $139,000 | Chicago Title Company | |
| Coast Federal Bank Fsb | $135,207 | Chicago Title Company |
Source: Public Records
Mortgage History
| Date | Status | Borrower | Loan Amount |
|---|---|---|---|
| Open | Polanco David O | $170,000 | |
| Previous Owner | Polanco David O | $125,100 |
Source: Public Records
Tax History
| Year | Tax Paid | Tax Assessment Tax Assessment Total Assessment is a certain percentage of the fair market value that is determined by local assessors to be the total taxable value of land and additions on the property. | Land | Improvement |
|---|---|---|---|---|
| 2025 | $3,405 | $236,219 | $127,290 | $108,929 |
| 2024 | $3,405 | $231,589 | $124,795 | $106,794 |
| 2023 | $3,326 | $227,049 | $122,349 | $104,700 |
| 2022 | $3,238 | $222,598 | $119,950 | $102,648 |
| 2021 | $3,178 | $218,235 | $117,599 | $100,636 |
| 2019 | $3,096 | $211,764 | $114,112 | $97,652 |
| 2018 | $2,875 | $207,613 | $111,875 | $95,738 |
| 2016 | $2,668 | $199,553 | $107,532 | $92,021 |
| 2015 | $2,620 | $196,556 | $105,917 | $90,639 |
| 2014 | $2,588 | $192,707 | $103,843 | $88,864 |
Source: Public Records
Map
Nearby Homes
- 15865 Sierra Vista Ct
- 826 Del Valle Ave
- 16060 Las Vecinas Dr
- 611 Santo Oro Ave
- 1023 Gilwood Ave
- 11 Alley Way
- 15925 Amar Rd
- 15937 Amar Rd
- 1069 Aileron Ave
- 209 N Stimson Ave
- 15865 Cadwell St
- 138 Banbridge Ave
- 1084 Del Valle Ave
- 665 Lidford Ave
- 15426 Hayland St
- 16203 Bluebonnet St
- 16459 Main St
- 226 Shay Ave
- 401 Dixford Ln
- 16149 Abbey St
- 667 Del Valle Ave
- 657 Del Valle Ave
- 15938 Sierra Vista Ct
- 645 Del Valle Ave
- 648 Molinar Ave Unit 2
- 648 Molinar Ave
- 642 Molinar Ave
- 652 Molinar Ave
- 638 Molinar Ave
- 658 Del Valle Ave
- 658 Molinar Ave
- 660 Del Valle Ave
- 641 Del Valle Ave
- 632 Molinar Ave
- 650 Del Valle Ave
- 672 Del Valle Ave
- 664 Del Valle Ave
- 626 Molinar Ave
- 703 Del Valle Ave
- 644 Del Valle Ave
Your Personal Tour Guide
Ask me questions while you tour the home.