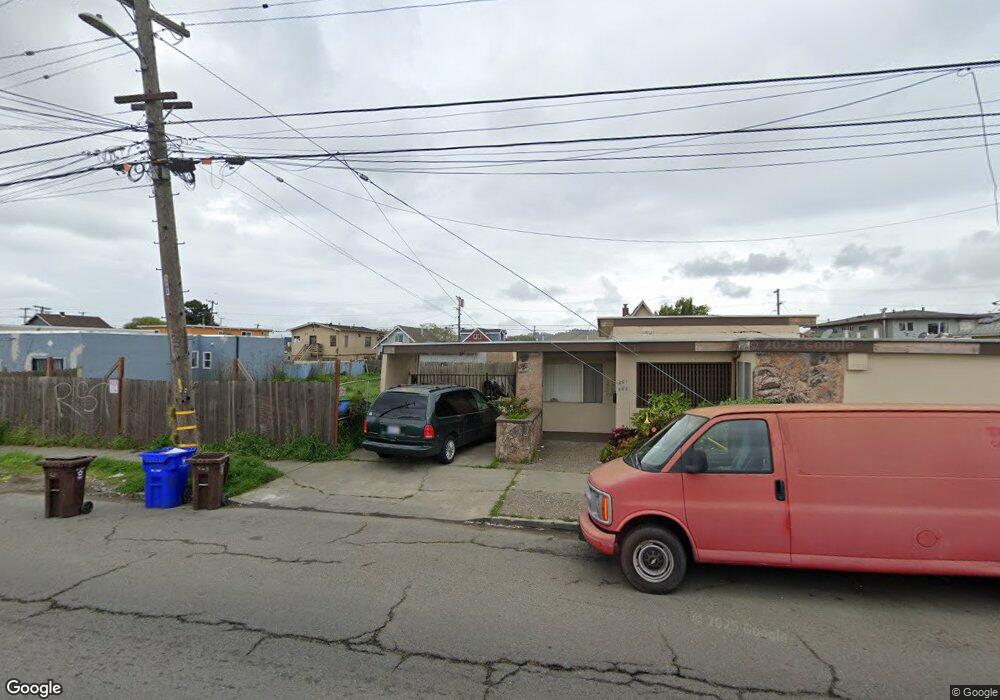
661 Harbour Way Unit 663 Richmond, CA 94801
Iron Triangle NeighborhoodEstimated Value: $501,000 - $702,000
3
Beds
3
Baths
1,576
Sq Ft
$359/Sq Ft
Est. Value
About This Home
This home is located at 661 Harbour Way Unit 663, Richmond, CA 94801 and is currently estimated at $565,305, approximately $358 per square foot. 661 Harbour Way Unit 663 is a home located in Contra Costa County with nearby schools including Peres Elementary School, Walter T. Helms Middle School, and Richmond High School.
Ownership History
Date
Name
Owned For
Owner Type
Purchase Details
Closed on
Jun 13, 2005
Sold by
Wright Steven
Bought by
Rowland Jason
Current Estimated Value
Purchase Details
Closed on
Jul 18, 1997
Sold by
Nasario Anthony
Bought by
Nasario Sheila D
Home Financials for this Owner
Home Financials are based on the most recent Mortgage that was taken out on this home.
Original Mortgage
$54,000
Interest Rate
7.7%
Mortgage Type
Purchase Money Mortgage
Purchase Details
Closed on
Jul 17, 1997
Sold by
Wright T H Jr Living Trust and Stephen
Bought by
Nasario Sheila D
Home Financials for this Owner
Home Financials are based on the most recent Mortgage that was taken out on this home.
Original Mortgage
$54,000
Interest Rate
7.7%
Mortgage Type
Purchase Money Mortgage
Create a Home Valuation Report for This Property
The Home Valuation Report is an in-depth analysis detailing your home's value as well as a comparison with similar homes in the area
Home Values in the Area
Average Home Value in this Area
Purchase History
| Date | Buyer | Sale Price | Title Company |
|---|---|---|---|
| Rowland Jason | -- | None Available | |
| Rowland Jason | -- | None Available | |
| Nasario Sheila D | -- | Commonwealth Land Title Co | |
| Nasario Sheila D | $60,000 | Commonwealth Land Title Co |
Source: Public Records
Mortgage History
| Date | Status | Borrower | Loan Amount |
|---|---|---|---|
| Previous Owner | Nasario Sheila D | $54,000 |
Source: Public Records
Tax History Compared to Growth
Tax History
| Year | Tax Paid | Tax Assessment Tax Assessment Total Assessment is a certain percentage of the fair market value that is determined by local assessors to be the total taxable value of land and additions on the property. | Land | Improvement |
|---|---|---|---|---|
| 2025 | $3,841 | $95,774 | $39,905 | $55,869 |
| 2024 | $3,690 | $93,897 | $39,123 | $54,774 |
| 2023 | $3,690 | $92,056 | $38,356 | $53,700 |
| 2022 | $3,557 | $90,252 | $37,604 | $52,648 |
| 2021 | $3,446 | $88,483 | $36,867 | $51,616 |
| 2019 | $3,212 | $85,860 | $35,774 | $50,086 |
| 2018 | $5,902 | $84,177 | $35,073 | $49,104 |
| 2017 | $5,608 | $82,528 | $34,386 | $48,142 |
| 2016 | $5,615 | $80,911 | $33,712 | $47,199 |
| 2015 | $5,542 | $79,697 | $33,206 | $46,491 |
| 2014 | $5,478 | $78,137 | $32,556 | $45,581 |
Source: Public Records
Map
Nearby Homes