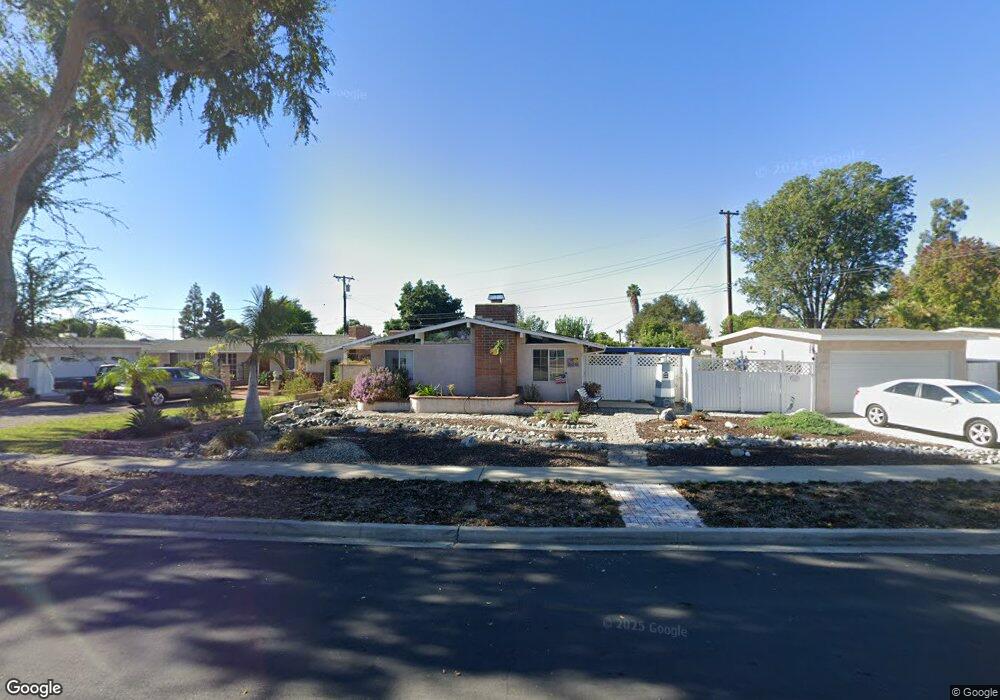
661 Mardina Way La Habra, CA 90631
Estimated Value: $782,000 - $850,000
2
Beds
2
Baths
1,261
Sq Ft
$648/Sq Ft
Est. Value
About This Home
This home is located at 661 Mardina Way, La Habra, CA 90631 and is currently estimated at $816,919, approximately $647 per square foot. 661 Mardina Way is a home located in Orange County with nearby schools including Jordan Elementary School, Rancho-Starbuck Intermediate School, and La Habra High School.
Ownership History
Date
Name
Owned For
Owner Type
Purchase Details
Closed on
Jul 31, 2019
Sold by
Allstun Brenda
Bought by
Allstun Brenda Joyce and Brenda J Allstun Living Trust
Current Estimated Value
Purchase Details
Closed on
Jun 26, 2007
Sold by
Allstun Dennis and Allstun Dennis W
Bought by
Allstun Brenda
Home Financials for this Owner
Home Financials are based on the most recent Mortgage that was taken out on this home.
Original Mortgage
$113,500
Outstanding Balance
$69,860
Interest Rate
6.21%
Mortgage Type
New Conventional
Estimated Equity
$747,059
Purchase Details
Closed on
Aug 17, 1993
Sold by
Ellis Gordon
Bought by
Allstun Dennis W and Allstun Brenda
Home Financials for this Owner
Home Financials are based on the most recent Mortgage that was taken out on this home.
Original Mortgage
$148,320
Interest Rate
6.81%
Mortgage Type
FHA
Create a Home Valuation Report for This Property
The Home Valuation Report is an in-depth analysis detailing your home's value as well as a comparison with similar homes in the area
Home Values in the Area
Average Home Value in this Area
Purchase History
| Date | Buyer | Sale Price | Title Company |
|---|---|---|---|
| Allstun Brenda Joyce | -- | None Available | |
| Allstun Brenda | -- | Landsafe Title | |
| Allstun Dennis W | $150,000 | Stewart Title |
Source: Public Records
Mortgage History
| Date | Status | Borrower | Loan Amount |
|---|---|---|---|
| Open | Allstun Brenda | $113,500 | |
| Previous Owner | Allstun Dennis W | $148,320 |
Source: Public Records
Tax History Compared to Growth
Tax History
| Year | Tax Paid | Tax Assessment Tax Assessment Total Assessment is a certain percentage of the fair market value that is determined by local assessors to be the total taxable value of land and additions on the property. | Land | Improvement |
|---|---|---|---|---|
| 2025 | $2,998 | $254,936 | $179,173 | $75,763 |
| 2024 | $2,998 | $249,938 | $175,660 | $74,278 |
| 2023 | $2,924 | $245,038 | $172,216 | $72,822 |
| 2022 | $2,889 | $240,234 | $168,839 | $71,395 |
| 2021 | $2,832 | $235,524 | $165,528 | $69,996 |
| 2020 | $2,824 | $233,109 | $163,830 | $69,279 |
| 2019 | $2,761 | $228,539 | $160,618 | $67,921 |
| 2018 | $2,657 | $224,058 | $157,468 | $66,590 |
| 2017 | $2,610 | $219,665 | $154,380 | $65,285 |
| 2016 | $2,555 | $215,358 | $151,353 | $64,005 |
| 2015 | $2,486 | $212,124 | $149,080 | $63,044 |
| 2014 | $2,411 | $207,969 | $146,159 | $61,810 |
Source: Public Records
Map
Nearby Homes
- 2100 Gregory Ln
- 2611 Gregory Ln
- 1000 Dolores St
- 16540 Whittier Blvd
- 1620 W El Portal Dr
- 401 Granada Dr
- 240 Oakland Dr
- 9331 Mikinda Ave
- 16621 Crape Myrtle Ln
- 9422 Canfield Dr
- 2311 Canfield Dr
- 2401 Canfield Dr
- 2641 Stanton Ave
- 1921 Pine Dr
- 10303 Pounds Ave
- 9915 Corella Ave
- 530 Spruce Way
- 16875 Sausalito Dr
- 421 N Marian St
- 2000 Baja Ave
- 651 Mardina Way
- 660 N Dexford Dr
- 650 N Dexford Dr
- 641 Mardina Way
- 640 N Dexford Dr
- 700 Mardina Way
- 706 Mardina Way
- 650 Mardina Way
- 710 Mardina Way
- 2221 Gregory Ln
- 646 Mardina Way
- 2211 Gregory Ln
- 720 N Dexford Dr
- 2231 Gregory Ln
- 631 Mardina Way
- 640 Mardina Way
- 630 N Dexford Dr
- 661 N Dexford Dr
- 671 N Dexford Dr
- 651 N Dexford Dr