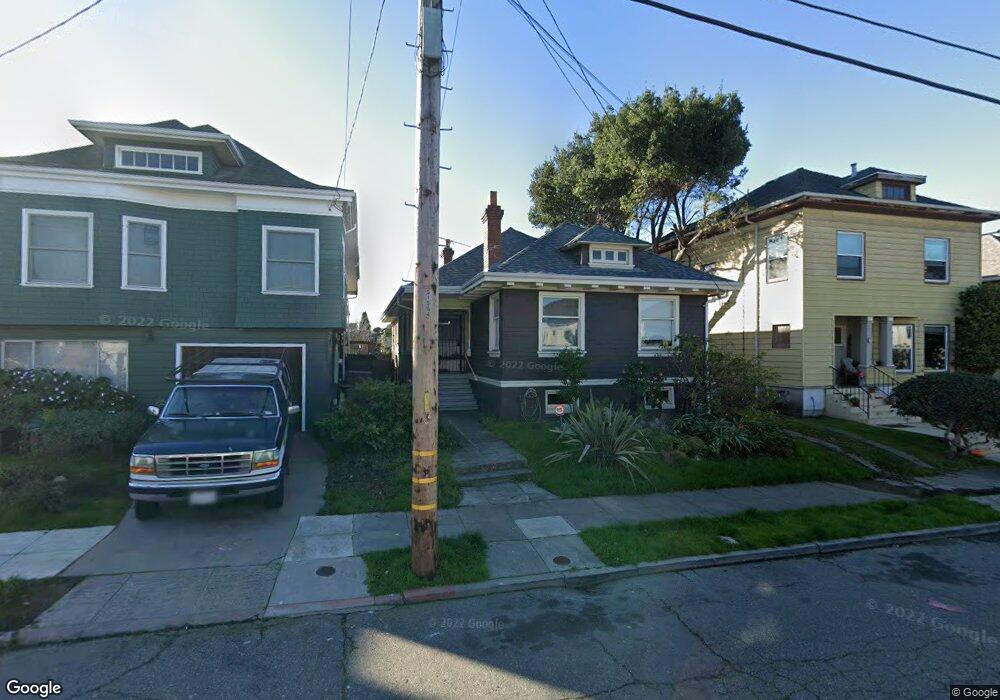
661 Poirier St Oakland, CA 94609
Bushrod NeighborhoodEstimated Value: $1,144,000 - $1,203,000
4
Beds
1
Bath
1,613
Sq Ft
$730/Sq Ft
Est. Value
About This Home
This home is located at 661 Poirier St, Oakland, CA 94609 and is currently estimated at $1,176,843, approximately $729 per square foot. 661 Poirier St is a home located in Alameda County with nearby schools including Sankofa United Elementary School, Peralta Elementary School, and Claremont Middle School.
Ownership History
Date
Name
Owned For
Owner Type
Purchase Details
Closed on
Feb 21, 2013
Sold by
Maeda Sue S and The Sue S Maeda Declaration Of
Bought by
The Entrust Group and Esmeralda M Marquez Ira #61-00076
Current Estimated Value
Home Financials for this Owner
Home Financials are based on the most recent Mortgage that was taken out on this home.
Original Mortgage
$318,000
Outstanding Balance
$221,579
Interest Rate
3.34%
Mortgage Type
Seller Take Back
Estimated Equity
$955,264
Purchase Details
Closed on
Oct 7, 1994
Sold by
Maeda Sue S and Maeda Sumiko S
Bought by
Maeda Sue S and Maeda Sumiko S
Create a Home Valuation Report for This Property
The Home Valuation Report is an in-depth analysis detailing your home's value as well as a comparison with similar homes in the area
Home Values in the Area
Average Home Value in this Area
Purchase History
| Date | Buyer | Sale Price | Title Company |
|---|---|---|---|
| The Entrust Group | $450,000 | Chicago Title Company | |
| Maeda Sue S | -- | -- |
Source: Public Records
Mortgage History
| Date | Status | Borrower | Loan Amount |
|---|---|---|---|
| Open | The Entrust Group | $318,000 |
Source: Public Records
Tax History Compared to Growth
Tax History
| Year | Tax Paid | Tax Assessment Tax Assessment Total Assessment is a certain percentage of the fair market value that is determined by local assessors to be the total taxable value of land and additions on the property. | Land | Improvement |
|---|---|---|---|---|
| 2025 | $10,226 | $677,258 | $203,177 | $474,081 |
| 2024 | $10,226 | $663,981 | $199,194 | $464,787 |
| 2023 | $10,739 | $650,963 | $195,289 | $455,674 |
| 2022 | $10,465 | $638,203 | $191,461 | $446,742 |
| 2021 | $10,023 | $625,690 | $187,707 | $437,983 |
| 2020 | $9,914 | $619,277 | $185,783 | $433,494 |
| 2019 | $9,553 | $607,138 | $182,141 | $424,997 |
| 2018 | $9,355 | $595,237 | $178,571 | $416,666 |
| 2017 | $9,003 | $583,565 | $175,069 | $408,496 |
| 2016 | $8,717 | $572,125 | $171,637 | $400,488 |
| 2015 | $8,673 | $563,534 | $169,060 | $394,474 |
| 2014 | $8,797 | $602,723 | $180,817 | $421,906 |
Source: Public Records
Map
Nearby Homes