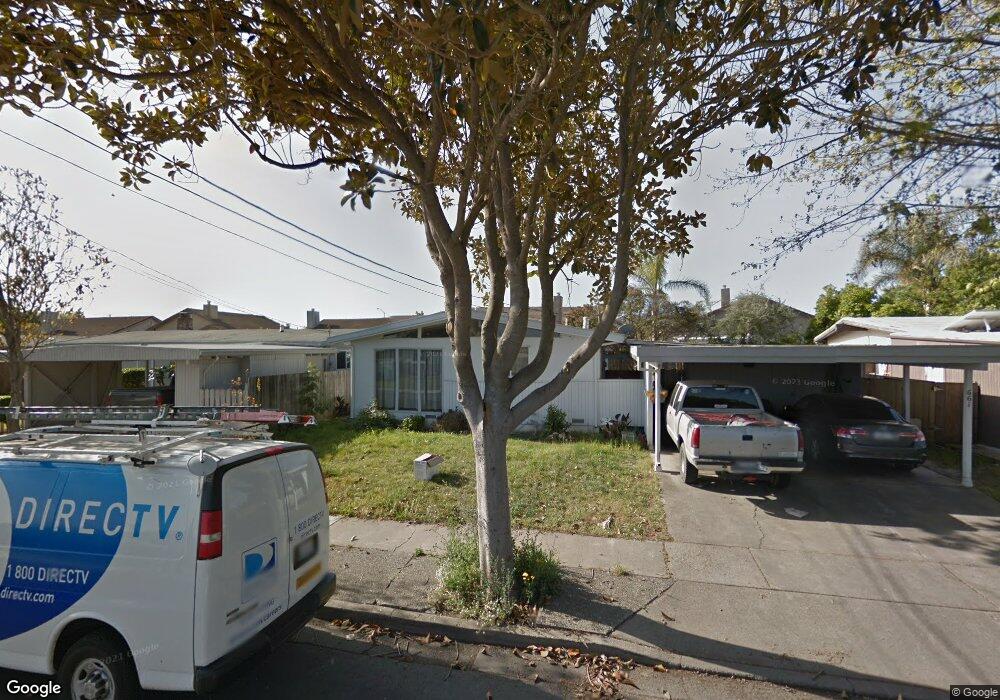
661 Walnut Ln Hollister, CA 95023
Estimated Value: $561,947 - $684,000
--
Bed
--
Bath
--
Sq Ft
5,576
Sq Ft Lot
About This Home
This home is located at 661 Walnut Ln, Hollister, CA 95023 and is currently estimated at $604,237. 661 Walnut Ln is a home located in San Benito County with nearby schools including R. O. Hardin Elementary School, Rancho San Justo School, and San Benito High School.
Ownership History
Date
Name
Owned For
Owner Type
Purchase Details
Closed on
Aug 15, 2003
Sold by
Head Wayne A
Bought by
Head Francine Ann
Current Estimated Value
Home Financials for this Owner
Home Financials are based on the most recent Mortgage that was taken out on this home.
Original Mortgage
$105,000
Interest Rate
5.46%
Mortgage Type
Purchase Money Mortgage
Purchase Details
Closed on
Jan 12, 1999
Sold by
Galdos Frank J and Head Francine Ann
Bought by
Head Francine Ann
Create a Home Valuation Report for This Property
The Home Valuation Report is an in-depth analysis detailing your home's value as well as a comparison with similar homes in the area
Home Values in the Area
Average Home Value in this Area
Purchase History
| Date | Buyer | Sale Price | Title Company |
|---|---|---|---|
| Head Francine Ann | -- | Chicago Title Co | |
| Head Francine Ann | -- | -- |
Source: Public Records
Mortgage History
| Date | Status | Borrower | Loan Amount |
|---|---|---|---|
| Closed | Head Francine Ann | $105,000 |
Source: Public Records
Tax History Compared to Growth
Tax History
| Year | Tax Paid | Tax Assessment Tax Assessment Total Assessment is a certain percentage of the fair market value that is determined by local assessors to be the total taxable value of land and additions on the property. | Land | Improvement |
|---|---|---|---|---|
| 2025 | $830 | $69,403 | $11,787 | $57,616 |
| 2023 | $830 | $66,710 | $11,330 | $55,380 |
| 2022 | $805 | $65,403 | $11,108 | $54,295 |
| 2021 | $794 | $64,122 | $10,891 | $53,231 |
| 2020 | $798 | $63,466 | $10,780 | $52,686 |
| 2019 | $776 | $62,222 | $10,569 | $51,653 |
| 2018 | $758 | $61,003 | $10,362 | $50,641 |
| 2017 | $748 | $59,808 | $10,159 | $49,649 |
| 2016 | $699 | $58,636 | $9,960 | $48,676 |
| 2015 | $693 | $57,756 | $9,811 | $47,945 |
| 2014 | $651 | $56,625 | $9,619 | $47,006 |
Source: Public Records
Map
Nearby Homes