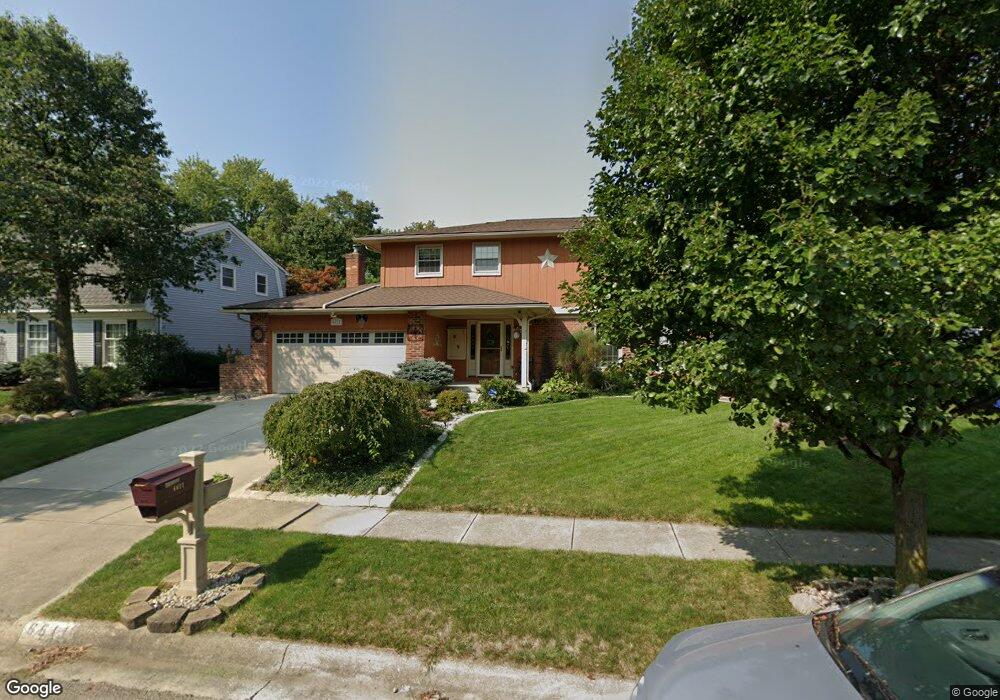
6611 Goldenrod Dr Columbus, OH 43229
Northgate NeighborhoodEstimated Value: $380,000 - $441,000
4
Beds
4
Baths
2,930
Sq Ft
$141/Sq Ft
Est. Value
About This Home
This home is located at 6611 Goldenrod Dr, Columbus, OH 43229 and is currently estimated at $412,939, approximately $140 per square foot. 6611 Goldenrod Dr is a home located in Franklin County with nearby schools including Northgate Intermediate, Alpine Elementary School, and Woodward Park Middle School.
Ownership History
Date
Name
Owned For
Owner Type
Purchase Details
Closed on
Sep 25, 2019
Sold by
Jensen Mikael and Jensen Mary
Bought by
Graham Jason Richard
Current Estimated Value
Home Financials for this Owner
Home Financials are based on the most recent Mortgage that was taken out on this home.
Original Mortgage
$242,526
Outstanding Balance
$216,206
Interest Rate
4.4%
Mortgage Type
FHA
Estimated Equity
$196,733
Purchase Details
Closed on
Dec 10, 2002
Sold by
Jensen Mikael and Rock Mary A
Bought by
Jensen Mikael and Jensen Mary
Purchase Details
Closed on
Oct 25, 2000
Sold by
Sutliff Robert W and Sutliff Marilyn R
Bought by
Jensen Mikael and Rock Mary A
Home Financials for this Owner
Home Financials are based on the most recent Mortgage that was taken out on this home.
Original Mortgage
$126,900
Interest Rate
7.91%
Mortgage Type
Purchase Money Mortgage
Purchase Details
Closed on
Mar 31, 1980
Bought by
Sutliff Robert W
Create a Home Valuation Report for This Property
The Home Valuation Report is an in-depth analysis detailing your home's value as well as a comparison with similar homes in the area
Home Values in the Area
Average Home Value in this Area
Purchase History
| Date | Buyer | Sale Price | Title Company |
|---|---|---|---|
| Graham Jason Richard | $247,000 | None Available | |
| Jensen Mikael | -- | -- | |
| Jensen Mikael | $158,700 | Connor Title Co | |
| Sutliff Robert W | $75,900 | -- |
Source: Public Records
Mortgage History
| Date | Status | Borrower | Loan Amount |
|---|---|---|---|
| Open | Graham Jason Richard | $242,526 | |
| Previous Owner | Jensen Mikael | $126,900 |
Source: Public Records
Tax History Compared to Growth
Tax History
| Year | Tax Paid | Tax Assessment Tax Assessment Total Assessment is a certain percentage of the fair market value that is determined by local assessors to be the total taxable value of land and additions on the property. | Land | Improvement |
|---|---|---|---|---|
| 2024 | $5,795 | $129,120 | $21,420 | $107,700 |
| 2023 | $5,721 | $129,115 | $21,420 | $107,695 |
| 2022 | $4,144 | $79,910 | $11,380 | $68,530 |
| 2021 | $4,152 | $79,910 | $11,380 | $68,530 |
| 2020 | $4,157 | $79,910 | $11,380 | $68,530 |
| 2019 | $4,132 | $68,120 | $11,380 | $56,740 |
| 2018 | $2,427 | $80,190 | $11,380 | $68,810 |
| 2017 | $4,862 | $80,190 | $11,380 | $68,810 |
| 2016 | $4,236 | $63,950 | $10,120 | $53,830 |
| 2015 | $1,902 | $63,250 | $10,120 | $53,130 |
| 2014 | $3,813 | $63,250 | $10,120 | $53,130 |
| 2013 | $1,881 | $63,245 | $10,115 | $53,130 |
Source: Public Records
Map
Nearby Homes
- 1755 Hillandale Ave
- 1635 Tendril Ct
- 1947 Rockdale Dr Unit 33
- 6496 Hearthstone Ave
- 6407 Skywae Dr
- 6458 Faircrest Rd
- 6355 Johnanne St
- 6448 Sharon Woods Blvd Unit B
- 6342 Bellmeadow Dr
- 6407 Faircrest Rd
- 2120 Willowick Dr Unit B
- 1421 Bosworth Place
- 1409 Bosworth Place
- 6245 Sharon Woods Blvd
- 6658 Walbridge St
- 1322 Bolenhill Ct
- 1294 Clydesdale Ct
- 1549 Alpine Dr
- 2197 Bayfield Dr
- 1268 Kildale Ct
- 6619 Goldenrod Dr
- 6603 Goldenrod Dr
- 6620 Merry Ln
- 6612 Merry Ln
- 6627 Goldenrod Dr
- 6604 Merry Ln
- 6628 Merry Ln
- 6604 Goldenrod Dr
- 6591 Goldenrod Dr
- 1789 Lakehill Ct
- 6594 Merry Ln
- 6639 Goldenrod Dr
- 6596 Goldenrod Dr
- 6634 Merry Ln
- 1801 Lakehill Ct
- 1755 Justice Ave
- 6584 Merry Ln
- 1806 Laylon Dr
- 6625 Merry Ln
- 6583 Goldenrod Dr