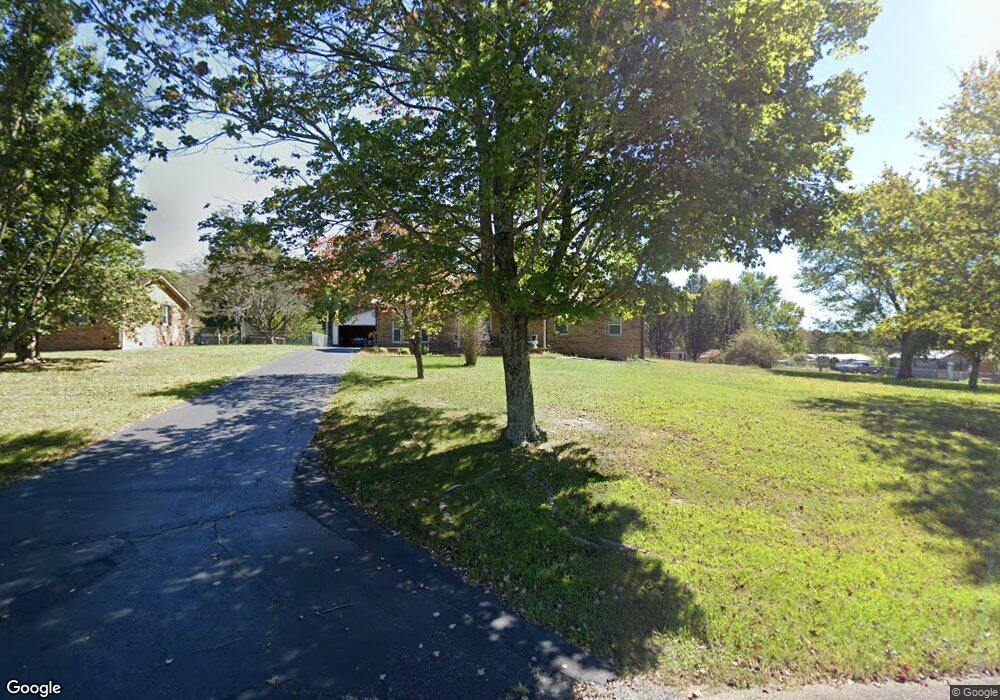
6611 Rader Ave Cookeville, TN 38506
Estimated Value: $243,386 - $353,000
--
Bed
1
Bath
1,653
Sq Ft
$175/Sq Ft
Est. Value
About This Home
This home is located at 6611 Rader Ave, Cookeville, TN 38506 and is currently estimated at $290,097, approximately $175 per square foot. 6611 Rader Ave is a home located in Putnam County with nearby schools including Cookeville High School, Algood Middle School, and Northeast Elementary School.
Ownership History
Date
Name
Owned For
Owner Type
Purchase Details
Closed on
May 8, 2003
Sold by
Alan Callahan Mark
Bought by
Diane Callahan Vickie
Current Estimated Value
Home Financials for this Owner
Home Financials are based on the most recent Mortgage that was taken out on this home.
Original Mortgage
$60,000
Outstanding Balance
$26,115
Interest Rate
5.81%
Estimated Equity
$263,982
Purchase Details
Closed on
May 7, 1993
Bought by
Callahan Mark Alan
Purchase Details
Closed on
Aug 24, 1988
Bought by
Arney Johnny J and Arney Ruth L
Purchase Details
Closed on
Jan 11, 1980
Bought by
Leach Everett and Leach Birtie
Create a Home Valuation Report for This Property
The Home Valuation Report is an in-depth analysis detailing your home's value as well as a comparison with similar homes in the area
Home Values in the Area
Average Home Value in this Area
Purchase History
| Date | Buyer | Sale Price | Title Company |
|---|---|---|---|
| Diane Callahan Vickie | -- | -- | |
| Callahan Mark Alan | $65,000 | -- | |
| Arney Johnny J | -- | -- | |
| Leach Everett | -- | -- |
Source: Public Records
Mortgage History
| Date | Status | Borrower | Loan Amount |
|---|---|---|---|
| Open | Leach Everett | $60,000 |
Source: Public Records
Tax History Compared to Growth
Tax History
| Year | Tax Paid | Tax Assessment Tax Assessment Total Assessment is a certain percentage of the fair market value that is determined by local assessors to be the total taxable value of land and additions on the property. | Land | Improvement |
|---|---|---|---|---|
| 2024 | $1,130 | $42,475 | $6,000 | $36,475 |
| 2023 | $1,130 | $42,475 | $6,000 | $36,475 |
| 2022 | $1,050 | $42,475 | $6,000 | $36,475 |
| 2021 | $1,050 | $42,475 | $6,000 | $36,475 |
| 2020 | $791 | $42,475 | $6,000 | $36,475 |
| 2019 | $791 | $27,025 | $4,000 | $23,025 |
| 2018 | $738 | $27,025 | $4,000 | $23,025 |
| 2017 | $738 | $27,025 | $4,000 | $23,025 |
| 2016 | $738 | $27,025 | $4,000 | $23,025 |
| 2015 | $738 | $27,025 | $4,000 | $23,025 |
| 2014 | $747 | $26,627 | $0 | $0 |
Source: Public Records
Map
Nearby Homes