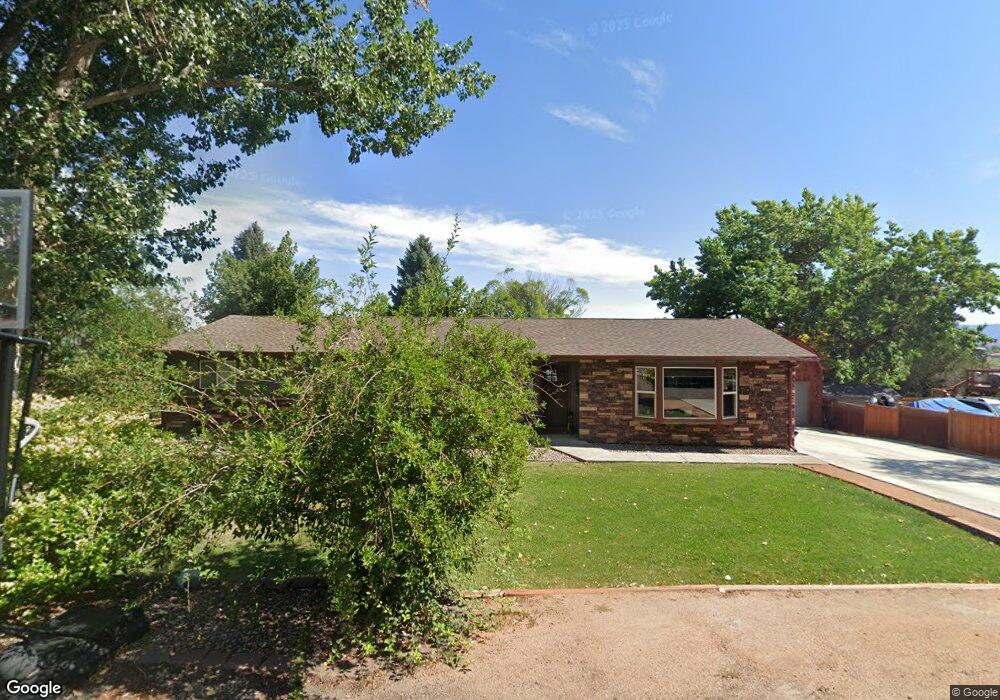
66111 Juniper Ct Montrose, CO 81403
Estimated Value: $432,407 - $606,000
4
Beds
2
Baths
1,768
Sq Ft
$284/Sq Ft
Est. Value
About This Home
This home is located at 66111 Juniper Ct, Montrose, CO 81403 and is currently estimated at $501,852, approximately $283 per square foot. 66111 Juniper Ct is a home located in Montrose County with nearby schools including Cottonwood Elementary School, Columbine Middle School, and Montrose High School.
Ownership History
Date
Name
Owned For
Owner Type
Purchase Details
Closed on
Jun 16, 2010
Sold by
Gahman Wilbur A and Dyke Karen Van
Bought by
Mcgehee Michael P and Mcgehee Kimberly S
Current Estimated Value
Home Financials for this Owner
Home Financials are based on the most recent Mortgage that was taken out on this home.
Original Mortgage
$192,408
Outstanding Balance
$128,699
Interest Rate
4.93%
Mortgage Type
Purchase Money Mortgage
Estimated Equity
$373,153
Purchase Details
Closed on
May 21, 1998
Sold by
Tea Douglas James and Tea Holly Sue
Bought by
Gahman Wilbur A and Gahman Van Dyke
Purchase Details
Closed on
Apr 18, 1991
Sold by
Densley James R and Densley Andrea L
Bought by
Tea Douglas James and Tea Holly Sue
Purchase Details
Closed on
Apr 27, 1989
Sold by
Pahl Ray L
Bought by
Densley James R and Densley Andrea L
Purchase Details
Closed on
Jun 6, 1986
Sold by
Smith Karen L
Bought by
Pahl Ray I
Purchase Details
Closed on
Mar 22, 1976
Sold by
Woodgate Subdivision
Bought by
Pahl Ray L and Pahl Karen L
Create a Home Valuation Report for This Property
The Home Valuation Report is an in-depth analysis detailing your home's value as well as a comparison with similar homes in the area
Home Values in the Area
Average Home Value in this Area
Purchase History
| Date | Buyer | Sale Price | Title Company |
|---|---|---|---|
| Mcgehee Michael P | -- | Land Title | |
| Mcgehee Michael P | $195,000 | None Available | |
| Gahman Wilbur A | $119,500 | -- | |
| Tea Douglas James | $65,300 | -- | |
| Densley James R | $55,000 | -- | |
| Pahl Ray I | -- | -- | |
| Pahl Ray L | $5,500 | -- |
Source: Public Records
Mortgage History
| Date | Status | Borrower | Loan Amount |
|---|---|---|---|
| Open | Mcgehee Michael P | $192,408 | |
| Closed | Mcgehee Michael P | $192,408 |
Source: Public Records
Tax History Compared to Growth
Tax History
| Year | Tax Paid | Tax Assessment Tax Assessment Total Assessment is a certain percentage of the fair market value that is determined by local assessors to be the total taxable value of land and additions on the property. | Land | Improvement |
|---|---|---|---|---|
| 2024 | $1,535 | $21,560 | $3,430 | $18,130 |
| 2023 | $1,535 | $26,190 | $4,170 | $22,020 |
| 2022 | $1,391 | $20,210 | $3,130 | $17,080 |
| 2021 | $1,434 | $20,800 | $3,220 | $17,580 |
| 2020 | $1,257 | $18,740 | $3,220 | $15,520 |
| 2019 | $1,266 | $18,740 | $3,220 | $15,520 |
| 2018 | $1,088 | $15,720 | $2,590 | $13,130 |
| 2017 | $1,079 | $15,720 | $2,590 | $13,130 |
| 2016 | $1,085 | $16,060 | $2,610 | $13,450 |
| 2015 | $1,065 | $16,060 | $2,610 | $13,450 |
| 2014 | $819 | $13,210 | $2,610 | $10,600 |
Source: Public Records
Map
Nearby Homes
- 4117 Waterfall Dr
- 66182 Crestview Dr
- TBD Lot 18 Crestview Dr
- 17143 Pintado Place
- 66356 Otter Rd
- TBD Woodgate Rd
- 16885 Wildwood Dr
- 1728 Keller Ct
- 1840 Otter Pond Cir
- 66711 Otter Rd
- 1712 Keller Ct
- 66595 Kinikin Rd
- TBD Otter Pond Cir
- Lot 14 Teton Ct
- TBD S Hwy 550 & Otter Rd
- TBD Lot 2-1 Woodgate Rd
- TBD Lot 2-2 Woodgate Rd
- TBD Lot 2-3 Woodgate Rd
- TBD Lot 3 Woodgate Rd
- TBD Lot 2 Woodgate Rd
- 66121 Juniper Ct
- 66105 Juniper Ct
- 66112 Crestview Dr
- 66126 Crestview Dr
- 66110 Juniper Ct
- 66098 Crestview Dr
- 66095 Juniper Ct
- 66125 Juniper Ct
- 66140 Crestview Dr
- 66096 Juniper Ct
- 66124 Juniper Ct
- 66107 Cottonwood Dr
- 66119 Cottonwood Dr
- 66154 Crestview Dr
- 66084 Crestview Dr
- 66095 Cottonwood Dr
- 4109 Waterfall Dr
- 66131 Cottonwood Dr
- 66168 Crestview Dr
- 66138 Juniper Ct