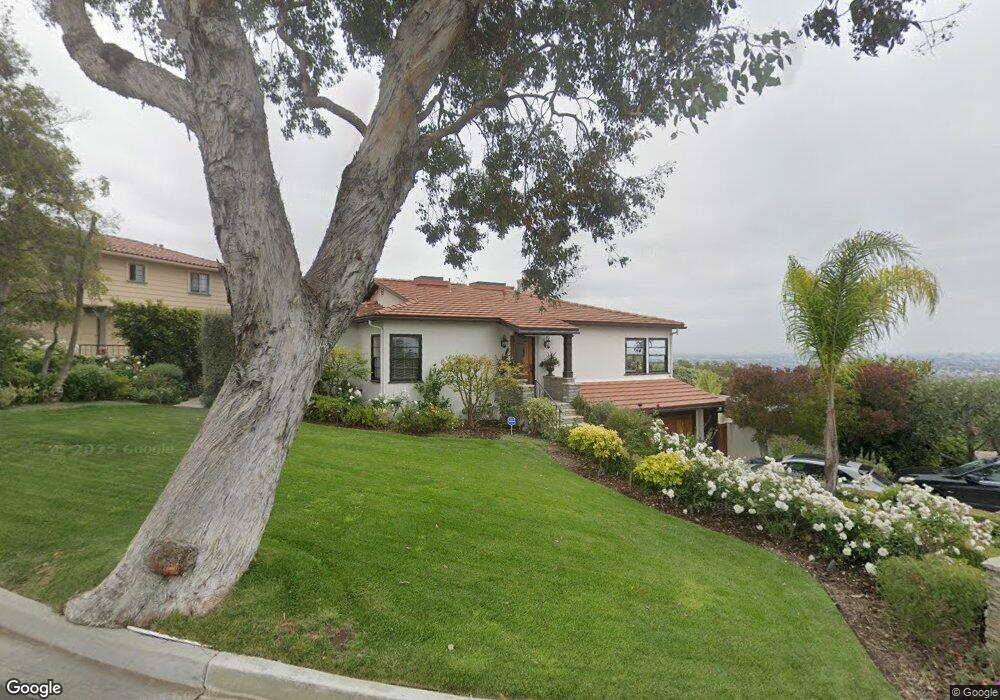
6613 Via Siena Rancho Palos Verdes, CA 90275
Estimated Value: $1,628,486 - $1,896,000
3
Beds
3
Baths
2,317
Sq Ft
$774/Sq Ft
Est. Value
About This Home
This home is located at 6613 Via Siena, Rancho Palos Verdes, CA 90275 and is currently estimated at $1,794,372, approximately $774 per square foot. 6613 Via Siena is a home located in Los Angeles County with nearby schools including Mira Catalina Elementary School, Miraleste Intermediate, and Palos Verdes Peninsula High School.
Ownership History
Date
Name
Owned For
Owner Type
Purchase Details
Closed on
Jul 31, 2020
Sold by
Stergion Monica
Bought by
Stergion Monica and Tsg Trust
Current Estimated Value
Purchase Details
Closed on
Aug 10, 2011
Sold by
Stergion Monica
Bought by
Stergion Monica and The Tsg Trust
Purchase Details
Closed on
Apr 24, 2009
Sold by
Johnston Helen E
Bought by
Johnston Helen E and Johnston Survivors Helen E
Purchase Details
Closed on
Jan 24, 2006
Sold by
Johnston Helen E and Johnston Decedents T Charles R
Bought by
Johnston Helen E and Johnston Survivors Helen E
Purchase Details
Closed on
Dec 21, 2004
Sold by
Johnston Helen E and The Helen E Johnston Survivors
Bought by
Johnston Helen E
Home Financials for this Owner
Home Financials are based on the most recent Mortgage that was taken out on this home.
Original Mortgage
$575,000
Interest Rate
5.5%
Mortgage Type
Purchase Money Mortgage
Purchase Details
Closed on
Jan 15, 2000
Sold by
Trust Johnston Helen E Tr Johnston Famil
Bought by
Johnston Helen E and Johnston Survivors Helen E
Create a Home Valuation Report for This Property
The Home Valuation Report is an in-depth analysis detailing your home's value as well as a comparison with similar homes in the area
Home Values in the Area
Average Home Value in this Area
Purchase History
| Date | Buyer | Sale Price | Title Company |
|---|---|---|---|
| Stergion Monica | -- | None Available | |
| Stergion Monica | -- | None Available | |
| Johnston Helen E | -- | None Available | |
| Johnston Helen E | -- | None Available | |
| Johnston Helen E | -- | Gateway | |
| Johnston Helen E | -- | -- |
Source: Public Records
Mortgage History
| Date | Status | Borrower | Loan Amount |
|---|---|---|---|
| Closed | Johnston Helen E | $575,000 |
Source: Public Records
Tax History Compared to Growth
Tax History
| Year | Tax Paid | Tax Assessment Tax Assessment Total Assessment is a certain percentage of the fair market value that is determined by local assessors to be the total taxable value of land and additions on the property. | Land | Improvement |
|---|---|---|---|---|
| 2025 | $14,944 | $1,287,749 | $985,133 | $302,616 |
| 2024 | $14,944 | $1,262,500 | $965,817 | $296,683 |
| 2023 | $14,637 | $1,237,746 | $946,880 | $290,866 |
| 2022 | $13,906 | $1,213,477 | $928,314 | $285,163 |
| 2021 | $13,850 | $1,189,684 | $910,112 | $279,572 |
| 2019 | $13,250 | $1,154,399 | $883,118 | $271,281 |
| 2018 | $13,118 | $1,131,764 | $865,802 | $265,962 |
| 2016 | $12,453 | $1,087,819 | $832,183 | $255,636 |
| 2015 | $12,424 | $1,071,480 | $819,683 | $251,797 |
| 2014 | $10,959 | $930,000 | $711,000 | $219,000 |
Source: Public Records
Map
Nearby Homes
- 6608 Via Siena
- 6604 Via Siena
- 6401 Corsini Place
- 2165 W General St
- 303 N Trotwood Ave
- 6432 Bramante Plaza
- 1971 W Santa Cruz St
- 6309 Via Colinita
- 30229 Kingsridge Dr
- 4329 Via Frascati
- 216 N Goodhope Ave
- 4052 Miraleste Dr
- 6337 Via Colinita
- 303 N Wycliff Ave
- 1460 W Sunrise Ln
- 1642 Saratoga Ln
- 314 S Miraleste Dr Unit 116
- 322 S Miraleste Dr Unit 176
- 308 S Miraleste Dr Unit 57
- 378 S Miraleste Dr Unit 431
- 6609 Via Siena
- 6605 Via Siena
- 4301 Miraleste Dr
- 4237 Miraleste Dr
- 6616 Via Siena
- 6620 Via Siena
- 6612 Via Siena
- 6601 Via Siena
- 4233 Miraleste Dr
- 4309 Miraleste Dr
- 6600 Via Siena
- 6569 Via Lorenzo
- 4229 Miraleste Dr
- 4313 Miraleste Dr
- 6565 Via Lorenzo
- 4225 Miraleste Dr
- 6536 Via Siena
- 4317 Miraleste Dr
- 6561 Via Lorenzo
- 4221 Miraleste Dr